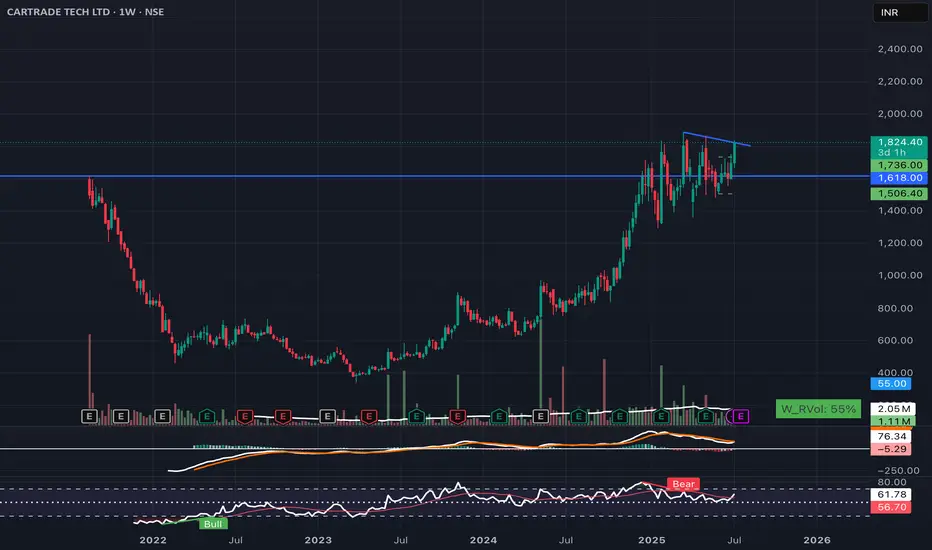
CARTRADE TECH LTD – Weekly Chart Summary
🔷 Pattern: Contracting Triangle / Symmetrical Triangle
* A descending trendline from highs near 1900 is acting as resistance
* Price is consolidating tightly within this triangle, showing strength just below resistance
🟦 Horizontal Zone (1618 - 1736)
* Major supply zone from previous highs
* Price has successfully reclaimed this zone and is holding above it, indicating demand
📊 Volume
* Volume remains steady with no distribution signs
* A breakout should ideally occur with a volume spike above 2 million shares
📉 MACD
* MACD is in positive territory, indicating bullish bias
* Signal lines are flattening, setting up for a potential bullish crossover if breakout occurs
📈 RSI
* RSI is holding above 60, a bullish zone
* No visible bearish divergence currently, healthy consolidation visible
📌 Bias: Bullish
* A breakout above the trendline (around 1880 to 1900) could lead to a strong move
* Upside potential toward 2200 to 2400 if breakout sustains
Conclusion
CARTRADE is trading in a bullish consolidation near key breakout levels. The structure suggests accumulation, and a breakout above the triangle could mark a continuation of the uptrend. Watch for high volume and a close above 1900.
Penafian
Maklumat dan penerbitan adalah tidak dimaksudkan untuk menjadi, dan tidak membentuk, nasihat untuk kewangan, pelaburan, perdagangan dan jenis-jenis lain atau cadangan yang dibekalkan atau disahkan oleh TradingView. Baca dengan lebih lanjut di Terma Penggunaan.
Penafian
Maklumat dan penerbitan adalah tidak dimaksudkan untuk menjadi, dan tidak membentuk, nasihat untuk kewangan, pelaburan, perdagangan dan jenis-jenis lain atau cadangan yang dibekalkan atau disahkan oleh TradingView. Baca dengan lebih lanjut di Terma Penggunaan.
