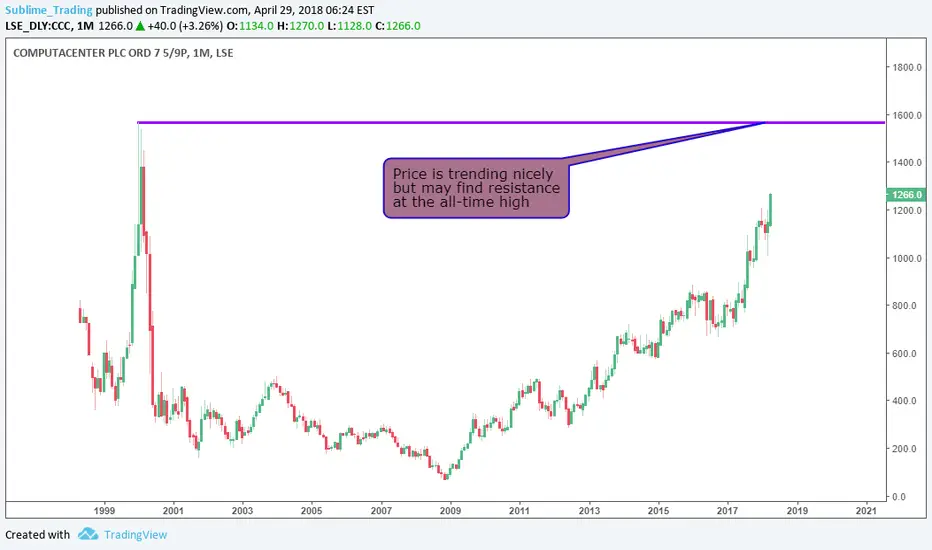
Prior to that price was in a downtrend from 2000 where it made an all-time high at £15.66. This all-time high area may cause problems which
may see it cause problems for price to advance higher. But if the trend is strong enough it should eventually break through.
Price is above the 200 simple moving averages on both the Weekly & Daily timeframes indicating that the trend is up and
price is forming higher highs and highers low. So far this month we are seeing a bullish bar so we just need to see more
bullish momentum and we could see price reach the all-time very soon.
If trades are taken now then we will have to take into account that price may reverse at the resistance level, so nerves would have to be controlled at that point to manage the trade accordingly.
The safest option would be to wait for price to move above the resistance level first before taking trades. Neither option is wrong but
the choice is down to the personality of the trader.
Any comments or questions, do not hesitate to leave them below. Hit agree if you share our sentiments!
Sublime Trading
Join Our Private Community
bit.ly/join-ST-community
Plus Get Our Ultimate Stock Market Blueprint.
bit.ly/join-ST-community
Plus Get Our Ultimate Stock Market Blueprint.
Penafian
Maklumat dan penerbitan adalah tidak bertujuan, dan tidak membentuk, nasihat atau cadangan kewangan, pelaburan, dagangan atau jenis lain yang diberikan atau disahkan oleh TradingView. Baca lebih dalam Terma Penggunaan.
