Overall Analysis & Current State
The chart depicts the stock price of Central Depository Services (India) Limited (CDSL) on a daily timeframe. The stock is in a pronounced and strong downtrend. Key technical observations confirm this:
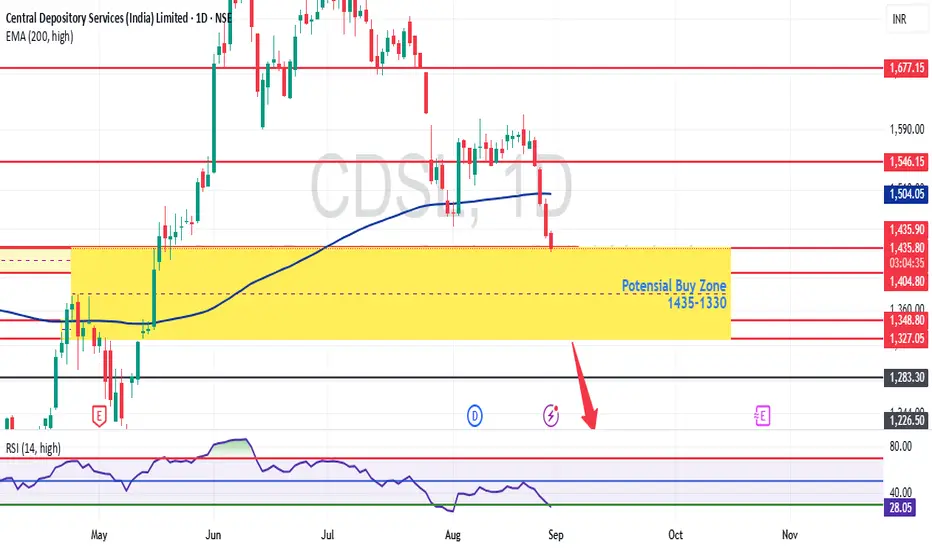
Price vs. 200 EMA: The price (₹1,436.05) is trading significantly below its 200-period Exponential Moving Average (₹1,504.05). This is a classic technical indicator of a long-term bearish trend.
Lower Highs & Lower Lows: The chart structure clearly shows a series of descending peaks (lower highs) and troughs (lower lows), which is the very definition of a downtrend.
Oversold RSI: The 14-period RSI is at 28.05. While this indicates the stock is oversold and a short-term bounce is possible, it is not a buy signal in a strong downtrend. The RSI can remain oversold for extended periods during a powerful decline.
Prediction of Direction (Short to Medium Term)
Short-term (Next few days to 2 weeks): A technical bounce or relief rally is highly probable from the current oversold levels. The price is approaching the identified "Potential Buy Zone" (₹1,435-₹1,330), which may attract bargain hunters.
Medium-term (Next 1-3 months): The overall trend remains bearish. Any bounce is likely to be sold into until proven otherwise. For the trend to reverse, the price would need to reclaim and hold above key resistance levels, notably the 200 EMA (around ₹1,504) and then the ₹1,590 level.
Entry, Exit & Stop-Loss Points: - This is a high-risk trade suitable only for experienced traders who can act quickly. This is not an investment for passive holders.
Scenario 1: Aggressive Trade on the Bounce (High Risk)
Entry Zone: ₹1,430 - ₹1,340 (Scale in within the "Potential Buy Zone". Do not invest the entire capital at once).
Stop-Loss (Hard Exit): ₹1,325 (on a closing basis). A break below the buy zone and the recent low of ₹1,327.05 would indicate the downtrend is accelerating, and the trade has failed.
Profit Target 1 (Exit 50%): ₹1,504 (200 EMA). This will be a strong resistance level.
Profit Target 2 (Exit remaining): ₹1,590 (Previous support, now resistance).
Risk/Reward: This setup offers a favorable risk/reward ratio (risking ~₹105 to make ~₹160-260).
Scenario 2: Wait for Trend Reversal (Lower Risk)
Ideal Entry: A safer approach is to wait for the trend to show concrete signs of reversal. This would be a close above the 200 EMA (₹1,504) with strong volume.
Stop-Loss: Below the most recent higher low (which hasn't formed yet).
Target: A move towards ₹1,677 and higher.
Long-Term Buy & Hold Recommendation:- No, I do not recommend buying CDSL for a long-term hold at this moment.
Reasoning:
The Trend is Your Friend: The long-term trend, as defined by the price action and the 200 EMA, is decisively down. Buying against a strong downtrend is called "catching a falling knife" and is a dangerous strategy.
Lack of Confirmation: There are no technical signs of a long-term bottom formation (e.g., double bottom, bullish divergence on weekly RSI, etc.). The chart shows a clear distribution and decline phase.
Better Opportunities Exist: Capital tied up in a stock that is falling or struggling to base can be deployed in other assets that are in clear uptrends, offering better and safer returns.
Final Conclusion
For Traders (Short-term): A tactical, small-sized bounce trade can be attempted within the ₹1,435-₹1,330 zone with a tight stop-loss below ₹1,325. This is a trade, not an investment. Book profits quickly at the specified resistance levels.
For Investors (Long-term): AVOID entering now. The stock needs time to stabilize and find a solid base. A long-term investment should only be considered after the price shows strength by reclaiming its 200 EMA and the overall market sentiment improves. Patience is key.
Disclaimer: This analysis is based on a 1D time frame and standard technical indicators EMA200. It is for educational purposes only and not financial advice. The stock market is volatile. Please conduct your own due diligence and consider your risk tolerance before making any investment decisions.
And we are not responsible for your loss
The chart depicts the stock price of Central Depository Services (India) Limited (CDSL) on a daily timeframe. The stock is in a pronounced and strong downtrend. Key technical observations confirm this:
Price vs. 200 EMA: The price (₹1,436.05) is trading significantly below its 200-period Exponential Moving Average (₹1,504.05). This is a classic technical indicator of a long-term bearish trend.
Lower Highs & Lower Lows: The chart structure clearly shows a series of descending peaks (lower highs) and troughs (lower lows), which is the very definition of a downtrend.
Oversold RSI: The 14-period RSI is at 28.05. While this indicates the stock is oversold and a short-term bounce is possible, it is not a buy signal in a strong downtrend. The RSI can remain oversold for extended periods during a powerful decline.
Prediction of Direction (Short to Medium Term)
Short-term (Next few days to 2 weeks): A technical bounce or relief rally is highly probable from the current oversold levels. The price is approaching the identified "Potential Buy Zone" (₹1,435-₹1,330), which may attract bargain hunters.
Medium-term (Next 1-3 months): The overall trend remains bearish. Any bounce is likely to be sold into until proven otherwise. For the trend to reverse, the price would need to reclaim and hold above key resistance levels, notably the 200 EMA (around ₹1,504) and then the ₹1,590 level.
Entry, Exit & Stop-Loss Points: - This is a high-risk trade suitable only for experienced traders who can act quickly. This is not an investment for passive holders.
Scenario 1: Aggressive Trade on the Bounce (High Risk)
Entry Zone: ₹1,430 - ₹1,340 (Scale in within the "Potential Buy Zone". Do not invest the entire capital at once).
Stop-Loss (Hard Exit): ₹1,325 (on a closing basis). A break below the buy zone and the recent low of ₹1,327.05 would indicate the downtrend is accelerating, and the trade has failed.
Profit Target 1 (Exit 50%): ₹1,504 (200 EMA). This will be a strong resistance level.
Profit Target 2 (Exit remaining): ₹1,590 (Previous support, now resistance).
Risk/Reward: This setup offers a favorable risk/reward ratio (risking ~₹105 to make ~₹160-260).
Scenario 2: Wait for Trend Reversal (Lower Risk)
Ideal Entry: A safer approach is to wait for the trend to show concrete signs of reversal. This would be a close above the 200 EMA (₹1,504) with strong volume.
Stop-Loss: Below the most recent higher low (which hasn't formed yet).
Target: A move towards ₹1,677 and higher.
Long-Term Buy & Hold Recommendation:- No, I do not recommend buying CDSL for a long-term hold at this moment.
Reasoning:
The Trend is Your Friend: The long-term trend, as defined by the price action and the 200 EMA, is decisively down. Buying against a strong downtrend is called "catching a falling knife" and is a dangerous strategy.
Lack of Confirmation: There are no technical signs of a long-term bottom formation (e.g., double bottom, bullish divergence on weekly RSI, etc.). The chart shows a clear distribution and decline phase.
Better Opportunities Exist: Capital tied up in a stock that is falling or struggling to base can be deployed in other assets that are in clear uptrends, offering better and safer returns.
Final Conclusion
For Traders (Short-term): A tactical, small-sized bounce trade can be attempted within the ₹1,435-₹1,330 zone with a tight stop-loss below ₹1,325. This is a trade, not an investment. Book profits quickly at the specified resistance levels.
For Investors (Long-term): AVOID entering now. The stock needs time to stabilize and find a solid base. A long-term investment should only be considered after the price shows strength by reclaiming its 200 EMA and the overall market sentiment improves. Patience is key.
Disclaimer: This analysis is based on a 1D time frame and standard technical indicators EMA200. It is for educational purposes only and not financial advice. The stock market is volatile. Please conduct your own due diligence and consider your risk tolerance before making any investment decisions.
And we are not responsible for your loss
Penafian
Maklumat dan penerbitan adalah tidak dimaksudkan untuk menjadi, dan tidak membentuk, nasihat untuk kewangan, pelaburan, perdagangan dan jenis-jenis lain atau cadangan yang dibekalkan atau disahkan oleh TradingView. Baca dengan lebih lanjut di Terma Penggunaan.
Penafian
Maklumat dan penerbitan adalah tidak dimaksudkan untuk menjadi, dan tidak membentuk, nasihat untuk kewangan, pelaburan, perdagangan dan jenis-jenis lain atau cadangan yang dibekalkan atau disahkan oleh TradingView. Baca dengan lebih lanjut di Terma Penggunaan.