Late Published "Only for Educational Purpose"
📊 Pattern Formation: Bullish Cup and Handle
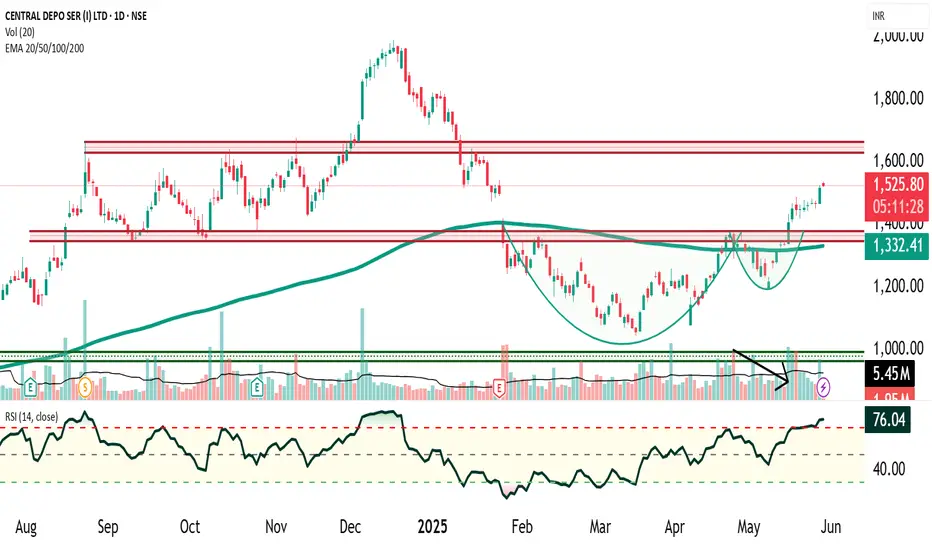
CDSL has officially broken out of a Bullish Cup and Handle chart pattern, signaling a strong technical breakout with high probability of an extended uptrend. This classic bullish continuation pattern took 4 months to form, indicating a well-developed structure with strong base formation.
📈 Volume & Momentum Indicators
✅ Volume Surge: Confirmed breakout with significant increase in volume — a clear sign of institutional buying
✅ RSI (Relative Strength Index): Currently above 60, indicating strong bullish momentum and room for further upside
✅ Price > 200 EMA: Signals that CDSL is in a confirmed long-term uptrend; the price holding above the 200-day exponential moving average is a strong bullish sign
🎯 Price Target Calculation – Cup and Handle Measurement Rule
Measurement Rule Target:
📌 Target Price = Neckline + Depth of Cup
🛡️ Stop-Loss (Risk Management)
Choose between Conservative and Aggressive exit strategies:
🔥 Trending Takeaways
CDSL is exhibiting a bullish breakout setup with volume confirmation, strong RSI, and price above 200 EMA. This combination often precedes explosive price action and potential multi-week rally.
🚀 #CDSLBreakout #CupAndHandle #BullishBreakout #TechnicalAnalysis #StockMarketIndia #SwingTrading #MomentumStocks #NSEStocks #ChartPatterns #VolumeAnalysis #StockMarketNews #RSI60 #200EMA #BreakoutStocks #PriceActionTrading
📊 Pattern Formation: Bullish Cup and Handle
CDSL has officially broken out of a Bullish Cup and Handle chart pattern, signaling a strong technical breakout with high probability of an extended uptrend. This classic bullish continuation pattern took 4 months to form, indicating a well-developed structure with strong base formation.
- Neckline Resistance: ₹1380
- Breakout Confirmation: Occurred with rising volume, confirming buyer participation
- Handle Formation: Characterized by a pullback on declining volume, a textbook sign of weak selling pressure and consolidation before a breakout
📈 Volume & Momentum Indicators
✅ Volume Surge: Confirmed breakout with significant increase in volume — a clear sign of institutional buying
✅ RSI (Relative Strength Index): Currently above 60, indicating strong bullish momentum and room for further upside
✅ Price > 200 EMA: Signals that CDSL is in a confirmed long-term uptrend; the price holding above the 200-day exponential moving average is a strong bullish sign
🎯 Price Target Calculation – Cup and Handle Measurement Rule
Measurement Rule Target:
📌 Target Price = Neckline + Depth of Cup
- Neckline: ₹1380
- Bottom of Cup (approx.): ₹1180
- Cup Depth = ₹1380 - ₹1180 = ₹200
- ➡️ Projected Target = ₹1380 + ₹200 = ₹1580
🛡️ Stop-Loss (Risk Management)
Choose between Conservative and Aggressive exit strategies:
- Conservative SL: Below the lowest low of the handle (approx. ₹1290)
- Aggressive SL: Below the breakout candle low (approx. ₹1345)
🔥 Trending Takeaways
CDSL is exhibiting a bullish breakout setup with volume confirmation, strong RSI, and price above 200 EMA. This combination often precedes explosive price action and potential multi-week rally.
🚀 #CDSLBreakout #CupAndHandle #BullishBreakout #TechnicalAnalysis #StockMarketIndia #SwingTrading #MomentumStocks #NSEStocks #ChartPatterns #VolumeAnalysis #StockMarketNews #RSI60 #200EMA #BreakoutStocks #PriceActionTrading
Penafian
Maklumat dan penerbitan adalah tidak bertujuan, dan tidak membentuk, nasihat atau cadangan kewangan, pelaburan, dagangan atau jenis lain yang diberikan atau disahkan oleh TradingView. Baca lebih dalam Terma Penggunaan.
Penafian
Maklumat dan penerbitan adalah tidak bertujuan, dan tidak membentuk, nasihat atau cadangan kewangan, pelaburan, dagangan atau jenis lain yang diberikan atau disahkan oleh TradingView. Baca lebih dalam Terma Penggunaan.
