Price Levels:
The stock was trading around ₹734.60, slightly down from the previous close of ₹735.60 (–0.14%)
Another snapshot shows ₹736.25 (with a range of ₹731.65 to ₹743.05)
These minor differences reflect changes across different timestamps and data sources—typical for live market quotes.
Daily Technical Indicators:
TradingView indicates a “Strong Sell” for moving averages and an overall “Sell” signal today on a 1-day timeframe
Investing.com mirrors this, also showing a “Strong Sell” on daily technicals
Investing.com India (Investing India) recently noted that on the daily frame, moving averages present a “Strong Buy” outlook (10 Buy vs. 2 Sell signals), but overall the daily technical status is Neutral—Oscillators and indicators were mixed
Moneycontrol's daily technical rating is again Neutral with classic pivot levels suggesting:
Resistance (Classic pivot):
R1: ₹742.90
R2: ₹748.45
R3: ₹754.90
Support:
S1: ₹730.90
S2: ₹724.45
S3: ₹718.90
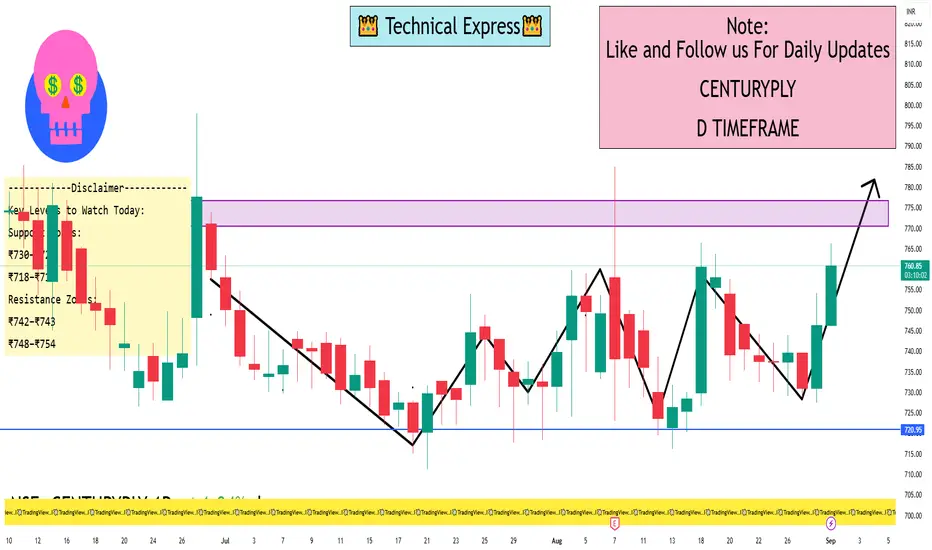
Key Levels to Watch Today:
Support Zones:
₹730–₹724 (key range where buyers may emerge)
₹718–₹719 (lower buffer if weakness continues)
Resistance Zones:
₹742–₹743 (initial cap, also R1 pivot)
₹748–₹754 (secondary resistance levels)
These include pivot points and typical price-level touchpoints for intraday traders
The stock was trading around ₹734.60, slightly down from the previous close of ₹735.60 (–0.14%)
Another snapshot shows ₹736.25 (with a range of ₹731.65 to ₹743.05)
These minor differences reflect changes across different timestamps and data sources—typical for live market quotes.
Daily Technical Indicators:
TradingView indicates a “Strong Sell” for moving averages and an overall “Sell” signal today on a 1-day timeframe
Investing.com mirrors this, also showing a “Strong Sell” on daily technicals
Investing.com India (Investing India) recently noted that on the daily frame, moving averages present a “Strong Buy” outlook (10 Buy vs. 2 Sell signals), but overall the daily technical status is Neutral—Oscillators and indicators were mixed
Moneycontrol's daily technical rating is again Neutral with classic pivot levels suggesting:
Resistance (Classic pivot):
R1: ₹742.90
R2: ₹748.45
R3: ₹754.90
Support:
S1: ₹730.90
S2: ₹724.45
S3: ₹718.90
Key Levels to Watch Today:
Support Zones:
₹730–₹724 (key range where buyers may emerge)
₹718–₹719 (lower buffer if weakness continues)
Resistance Zones:
₹742–₹743 (initial cap, also R1 pivot)
₹748–₹754 (secondary resistance levels)
These include pivot points and typical price-level touchpoints for intraday traders
I built a Buy & Sell Signal Indicator with 85% accuracy.
📈 Get access via DM or
WhatsApp: wa.link/d997q0
Contact - +91 76782 40962
| Email: techncialexpress@gmail.com
| Script Coder | Trader | Investor | From India
📈 Get access via DM or
WhatsApp: wa.link/d997q0
Contact - +91 76782 40962
| Email: techncialexpress@gmail.com
| Script Coder | Trader | Investor | From India
Penerbitan berkaitan
Penafian
The information and publications are not meant to be, and do not constitute, financial, investment, trading, or other types of advice or recommendations supplied or endorsed by TradingView. Read more in the Terms of Use.