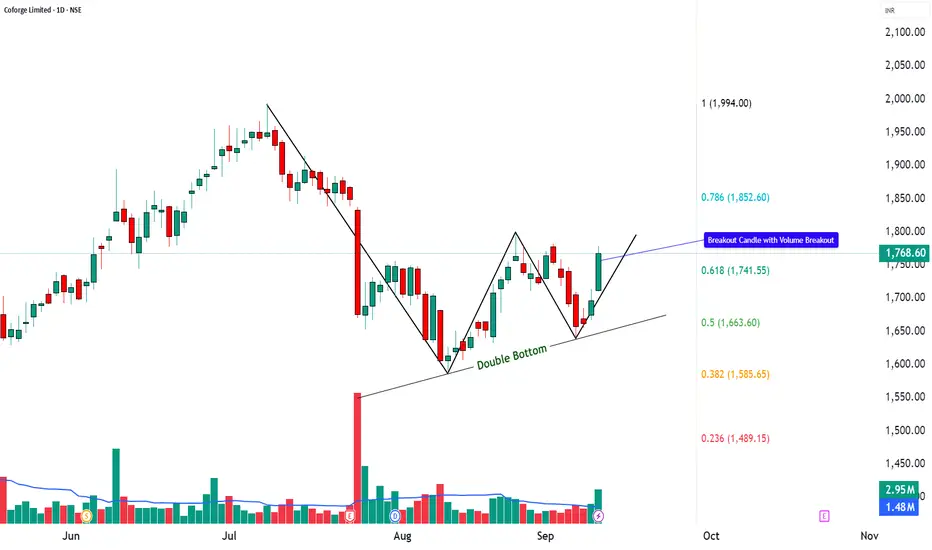
📌 Coforge Ltd. – Closing Price: ₹1,768.60
📊 Technical Indicators Explained
Coforge is showing strong technical signals. A Double Bottom pattern 📉➡️📈 suggests a possible bullish reversal, while a strong bullish candle 🔥 confirms momentum. The RSI breakout ⚡, MACD crossover 📊, and volume surge 🚀 all indicate growing trader participation. With supports holding firm and resistances nearby, the stock is entering a decisive zone.
________________________________________
📈 Bullish Case – Why the stock could go up
Double Bottom signals potential trend reversal.
Strong bullish candle with volume validates buying interest.
RSI breakout + MACD crossover = bullish confirmation.
Fibonacci retracement levels open upside zones towards ₹1,852 – ₹1,994+.
📉 Bearish Case – Potential downside risks
If price fails to sustain above ₹1,726, weakness may return.
Broader market corrections could weigh on momentum.
A breakdown below ₹1,657 would weaken the bullish outlook.
⚡ Momentum Case – Short-term Trading Edge
Strong bullish candle + RSI breakout = near-term strength.
Sustaining above ₹1,780–₹1,800 could push towards higher Fibonacci levels.
Heavy volume indicates short-term traders are active.
📊 Support & Resistance Levels
Support Zones: ₹1,657 | ₹1,683.67 | ₹1,726.13
Resistance Zones: ₹1,794.93 | ₹1,821.27 | ₹1,863.73
📅 Short-term vs. Long-term Perspective
Short-term: Stock may test resistance levels between ₹1,795 – ₹1,860 if momentum sustains.
Long-term: Formation of a double bottom indicates potential for a structural trend reversal if higher levels hold.
✅ Conclusion: Coforge is showing a technical reversal pattern with strong momentum signals.
👉 The stock is at a key breakout zone — short-term traders may track resistances closely, while long-term investors can monitor the double bottom for confirmation of sustained trend change.
⚠️ Disclaimer – Please Read Carefully
The information shared here is meant purely for learning and awareness. It is not a buy or sell recommendation and should not be taken as investment advice. I am not a SEBI-registered investment advisor, and all views expressed are based on personal study, chart patterns, and publicly available market data.
Trading — whether in stocks or options — carries risk. Markets can move unexpectedly, and losses can sometimes exceed the money you have invested. Past performance or past setups do not guarantee future results.
If you are a beginner, treat this as a guide to understand how the market works — practice on paper trades before risking real money. If you are experienced, always assess your own risk, position sizing, and strategy suitability before entering trades.
Consult a SEBI-registered financial advisor before making any real trading decision. By engaging with this content, you acknowledge full responsibility for your trades and investments.
💬 Found this useful?
🔼 Give this post a Boost to help more traders discover clean, structured learning.
✍️ Drop your thoughts, questions, or setups in the comments — let’s grow together!
🔁 Share with fellow traders and beginners to spread awareness.
👉 “If you liked this breakdown, follow for more clean, structured setups with discipline at the core.”
🚀 Stay Calm. Stay Clean. Trade With Patience.
Trade Smart | Learn Zones | Be Self-Reliant 📊
STWP | Mentor & Demand-Supply Specialist | Empowering traders through structured learning |
simpletradewithpatience.com
Community: chat.whatsapp.com/BEYz0tkqP0fJPBCWf59uel
wa.me/message/6IOPHGOXMGZ4N1
Educational Only
simpletradewithpatience.com
Community: chat.whatsapp.com/BEYz0tkqP0fJPBCWf59uel
wa.me/message/6IOPHGOXMGZ4N1
Educational Only
Penafian
Maklumat dan penerbitan adalah tidak bertujuan, dan tidak membentuk, nasihat atau cadangan kewangan, pelaburan, dagangan atau jenis lain yang diberikan atau disahkan oleh TradingView. Baca lebih dalam Terma Penggunaan.