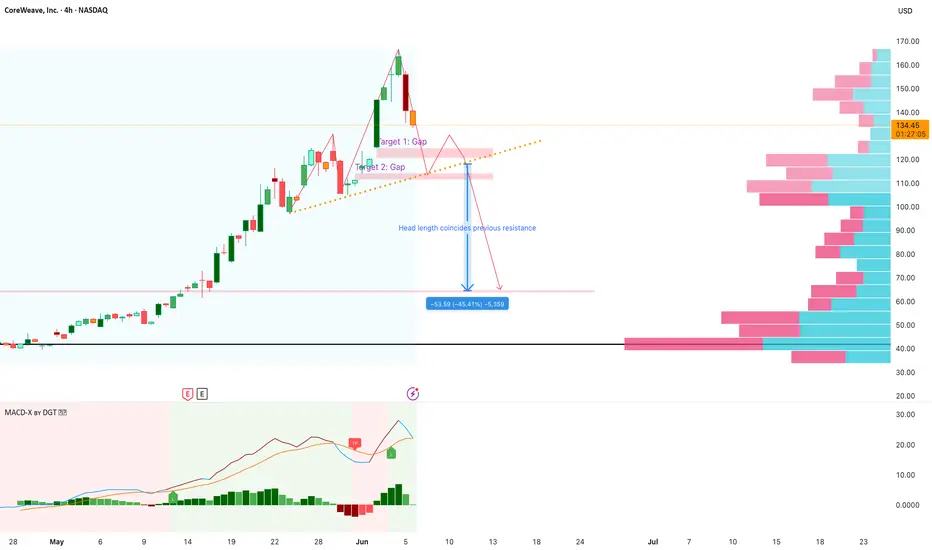
CoreWeave – Possible Head & Shoulders Breakdown
📊 Overview
- The stock is currently trading at $138.04, after a sharp drop of -15.37% today.
- A potential Head and Shoulders pattern is forming, suggesting a bearish reversal after a parabolic uptrend.
🔍 Chart Patterns & Key Levels
🟥 Head and Shoulders Formation
- The head appears to be forming now.
- The potential head height suggests a potential downside of ~45%, which aligns with a previous resistance zone near $70–75.
- If confirmed, this pattern could lead to a full retracement to this level.
📉 Gap Targets (Short-term)
- Target 1: There is a gap-fill level around $125–128 (highlighted in light pink).
- Target 2: Another gap support zone exists around $110–112.
📐 Trendline Support
- A dashed orange trendline (upward-sloping) may offer temporary support.
- If this is broken, selling pressure could intensify.
📊 MACD (Momentum Indicator)
- MACD lines are elevated but appear to be turning, indicating that momentum may be exhausted.
- No bearish crossover yet, but watch for one as a signal of further weakness.
💸 Average Cost
- Most transactions executed at 40$. Good for those realizing current rally.
⚠️ Strategy & Risk
- A break below $130 could trigger a deeper correction toward the gap levels.
- If the head-and-shoulders neckline breaks, expect a move toward $70s, which represents a -45% retracement from the top.
- Monitor volume and MACD crossover for confirmation of a breakdown.
- Consider using tight stop-losses above the right shoulder if trading short.
Penafian
Maklumat dan penerbitan adalah tidak bertujuan, dan tidak membentuk, nasihat atau cadangan kewangan, pelaburan, dagangan atau jenis lain yang diberikan atau disahkan oleh TradingView. Baca lebih dalam Terma Penggunaan.
Penafian
Maklumat dan penerbitan adalah tidak bertujuan, dan tidak membentuk, nasihat atau cadangan kewangan, pelaburan, dagangan atau jenis lain yang diberikan atau disahkan oleh TradingView. Baca lebih dalam Terma Penggunaan.