Despite the strong quarterly results, the stock was penalized due to a lower outlook for Q2, a consequence of uncertainties surrounding tariffs, leading to a 20% decline.
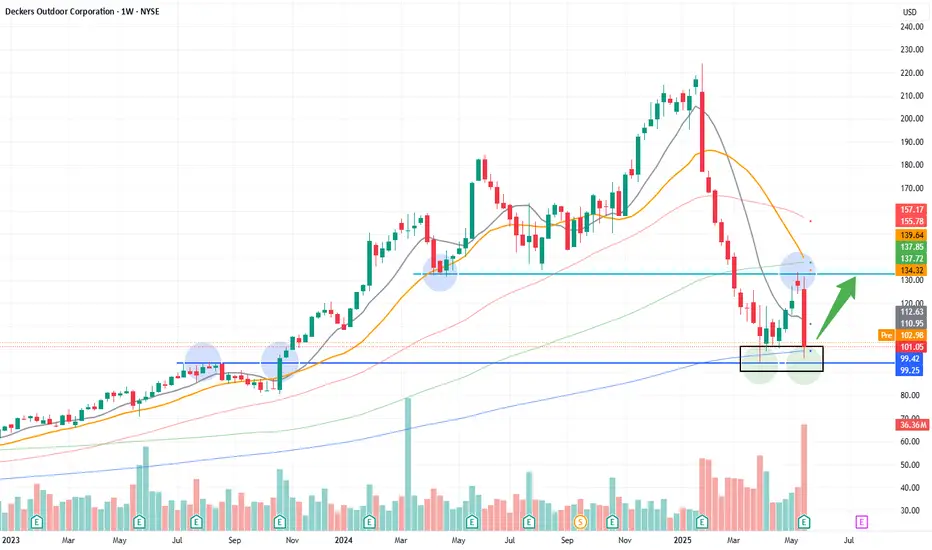
The price is reaching the weekly 200-day simple moving average (blue line) for the second time, coinciding with a long-term support level (also marked in blue), initiating the formation of a double bottom pattern.
The first target is the light blue resistance area around $130 (+30%), where a potential confirmation of the double bottom could occur with a breakout of the neckline, followed by a further 25–30% increase
Penafian
Maklumat dan penerbitan adalah tidak dimaksudkan untuk menjadi, dan tidak membentuk, nasihat untuk kewangan, pelaburan, perdagangan dan jenis-jenis lain atau cadangan yang dibekalkan atau disahkan oleh TradingView. Baca dengan lebih lanjut di Terma Penggunaan.
Penafian
Maklumat dan penerbitan adalah tidak dimaksudkan untuk menjadi, dan tidak membentuk, nasihat untuk kewangan, pelaburan, perdagangan dan jenis-jenis lain atau cadangan yang dibekalkan atau disahkan oleh TradingView. Baca dengan lebih lanjut di Terma Penggunaan.