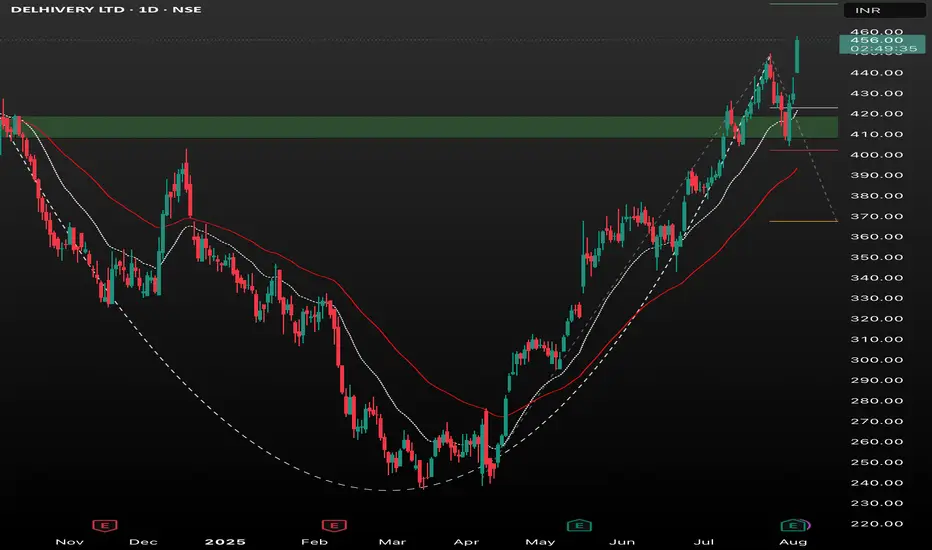
DELHIVE Ltd. is currently exhibiting a strong bullish trend, as reflected by the recent upward momentum and favorable technical indicators (RSI: 62.21, MACD: bullish crossover, Trend: Strong Bullish, ADX: Buy). The stock has retraced towards the 0.886 Fibonacci level near ₹422 after a sharp rally, while strong support zones are identified at the 0.786 (₹402) and 0.618 (₹367) Fibonacci levels. Resistance is seen around the ₹475 mark. Watch for price action near the current support zone—holding above ₹422 can lead to a trend continuation towards ₹475, while a close below ₹402 might trigger further retracement.
Key Indicators: RSI Neutral, MACD Bullish, Volatility Moderate, Trend Strong Bullish.
Actionable Insight: Monitor for bullish reversal signals near identified support or a breakout above recent highs for trend continuation.
Feel free to adjust the text for your style or trading ideas!
Key Indicators: RSI Neutral, MACD Bullish, Volatility Moderate, Trend Strong Bullish.
Actionable Insight: Monitor for bullish reversal signals near identified support or a breakout above recent highs for trend continuation.
Feel free to adjust the text for your style or trading ideas!
Penafian
Maklumat dan penerbitan adalah tidak dimaksudkan untuk menjadi, dan tidak membentuk, nasihat untuk kewangan, pelaburan, perdagangan dan jenis-jenis lain atau cadangan yang dibekalkan atau disahkan oleh TradingView. Baca dengan lebih lanjut di Terma Penggunaan.
Penafian
Maklumat dan penerbitan adalah tidak dimaksudkan untuk menjadi, dan tidak membentuk, nasihat untuk kewangan, pelaburan, perdagangan dan jenis-jenis lain atau cadangan yang dibekalkan atau disahkan oleh TradingView. Baca dengan lebih lanjut di Terma Penggunaan.
