Hit like & follow guys ;)
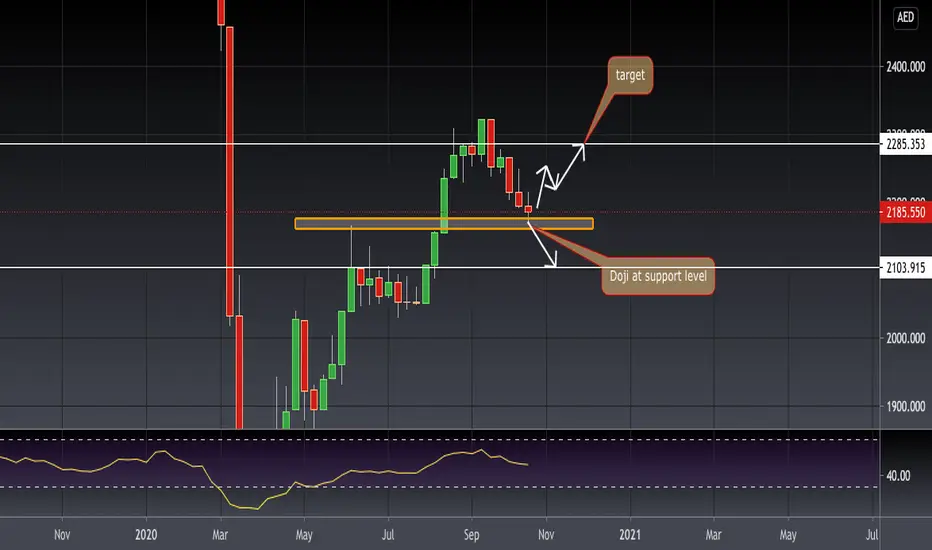
If we analyse weekly chart the uptrend is still intact and we are seeing a perfect doji candle at the support level. Good chances of market continuing its uptrend from this level. If 2185 holds up and if we can see a weekly candle close above 2220 it will be a good sign that market want to go higher. But at the same time if this level does not hold market can quickly slip to 2100 levels. Over all on a bigger time frame it looks bullish.
If we analyse weekly chart the uptrend is still intact and we are seeing a perfect doji candle at the support level. Good chances of market continuing its uptrend from this level. If 2185 holds up and if we can see a weekly candle close above 2220 it will be a good sign that market want to go higher. But at the same time if this level does not hold market can quickly slip to 2100 levels. Over all on a bigger time frame it looks bullish.
Penafian
Maklumat dan penerbitan adalah tidak bertujuan, dan tidak membentuk, nasihat atau cadangan kewangan, pelaburan, dagangan atau jenis lain yang diberikan atau disahkan oleh TradingView. Baca lebih dalam Terma Penggunaan.
Penafian
Maklumat dan penerbitan adalah tidak bertujuan, dan tidak membentuk, nasihat atau cadangan kewangan, pelaburan, dagangan atau jenis lain yang diberikan atau disahkan oleh TradingView. Baca lebih dalam Terma Penggunaan.