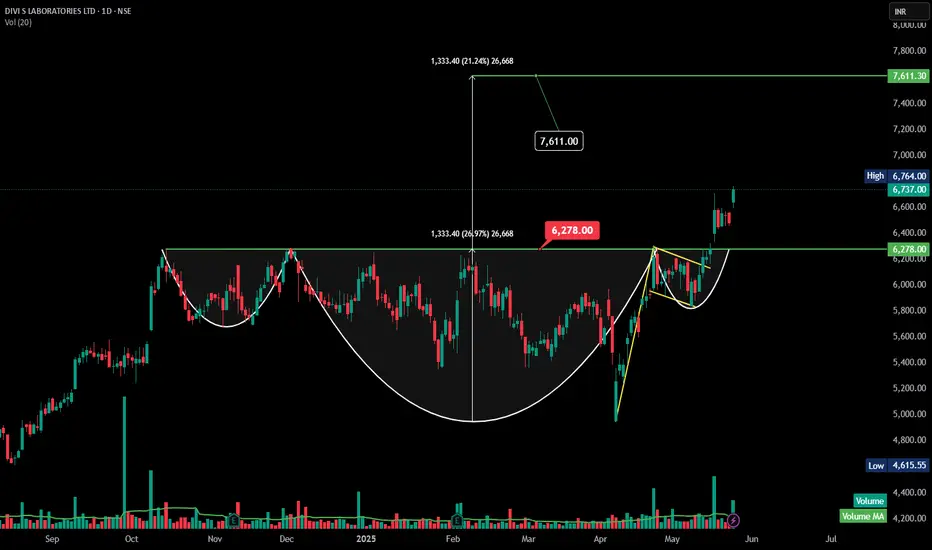
Thanks for the clarification! Yes — the chart **does** resemble an **Inverted Head and Shoulders** pattern (a bullish reversal pattern), especially visible in the price structure before the breakout above ₹6,278.
---
### 🟢 **Inverted Head and Shoulders – Analysis (Divi's Lab)**
#### **Pattern Structure:**
* **Left Shoulder:** Formed in March.
* **Head:** Deepest low around early April.
* **Right Shoulder:** Higher low formed in late April to early May.
* **Neckline:** Breakout above the ₹6,278 level confirms the pattern.
#### **Breakout Confirmation:**
* Breakout is strong, supported by **increasing volume**.
* Target derived from neckline to head height = approx. ₹1,333.
* **Target after breakout:** ₹6,278 + ₹1,333 = **₹7,611** (already marked on the chart).
---
---
### 🟢 **Inverted Head and Shoulders – Analysis (Divi's Lab)**
#### **Pattern Structure:**
* **Left Shoulder:** Formed in March.
* **Head:** Deepest low around early April.
* **Right Shoulder:** Higher low formed in late April to early May.
* **Neckline:** Breakout above the ₹6,278 level confirms the pattern.
#### **Breakout Confirmation:**
* Breakout is strong, supported by **increasing volume**.
* Target derived from neckline to head height = approx. ₹1,333.
* **Target after breakout:** ₹6,278 + ₹1,333 = **₹7,611** (already marked on the chart).
---
Penafian
Maklumat dan penerbitan adalah tidak bertujuan, dan tidak membentuk, nasihat atau cadangan kewangan, pelaburan, dagangan atau jenis lain yang diberikan atau disahkan oleh TradingView. Baca lebih dalam Terma Penggunaan.
Penafian
Maklumat dan penerbitan adalah tidak bertujuan, dan tidak membentuk, nasihat atau cadangan kewangan, pelaburan, dagangan atau jenis lain yang diberikan atau disahkan oleh TradingView. Baca lebih dalam Terma Penggunaan.