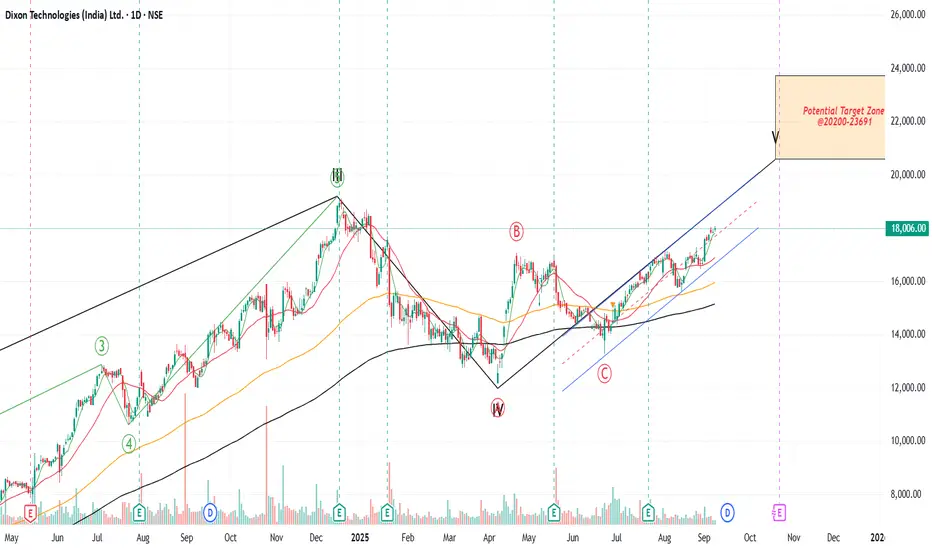
Dixon Technologies: CMP: 18006
✨ Elliott Wave View: Dixon Technologies is currently exhibiting a classic Elliott Wave structure on the daily chart. The impulsive phase (waves 1, 2, 3, 4, 5) is well-formed, showing sustained upward momentum, followed by an a-b-c corrective sequence.
Wave V Uptrend: The stock has completed its a-b-c correction and is now progressing into wave V, with bullish structure and higher price targets in focus.
🛑 Support & Resistance: Strong support is observed around ₹17,000–₹17,800, aligning with moving averages and prior pivots; resistance is projected near ₹20,000–₹21,000, the next major Elliott extension.
📌 Strategy (Entry & Targets):
Momentum Entry: If price breaks and sustains above ₹18,200, quick rally possible till ₹19,000–19,200. Stop Loss: ₹17,600
Avoid chasing now at ₹18,000 (overbought). Wait for dip toward ₹16,800–17,200 (good R:R)Prefer dips near ₹16,800–17,200 or breakout above ₹18,200.
T1: ₹18,800–19,200
T2: ₹20,500–21,200
📌 Thanks a ton for checking out my idea! Hope it sparked some value for you.
🙏 Follow for more insights
👍 Boost if you found it helpful
✍️ Drop a comment with your thoughts below!
Dagangan aktif
Dixon is at 200 DMEA, and may see a support and buying should emerge at this levels. Its good time to invest, duing Intraday it may even test 14750 levels.
Penerbitan berkaitan
Penafian
Maklumat dan penerbitan adalah tidak bertujuan, dan tidak membentuk, nasihat atau cadangan kewangan, pelaburan, dagangan atau jenis lain yang diberikan atau disahkan oleh TradingView. Baca lebih dalam Terma Penggunaan.
Penerbitan berkaitan
Penafian
Maklumat dan penerbitan adalah tidak bertujuan, dan tidak membentuk, nasihat atau cadangan kewangan, pelaburan, dagangan atau jenis lain yang diberikan atau disahkan oleh TradingView. Baca lebih dalam Terma Penggunaan.