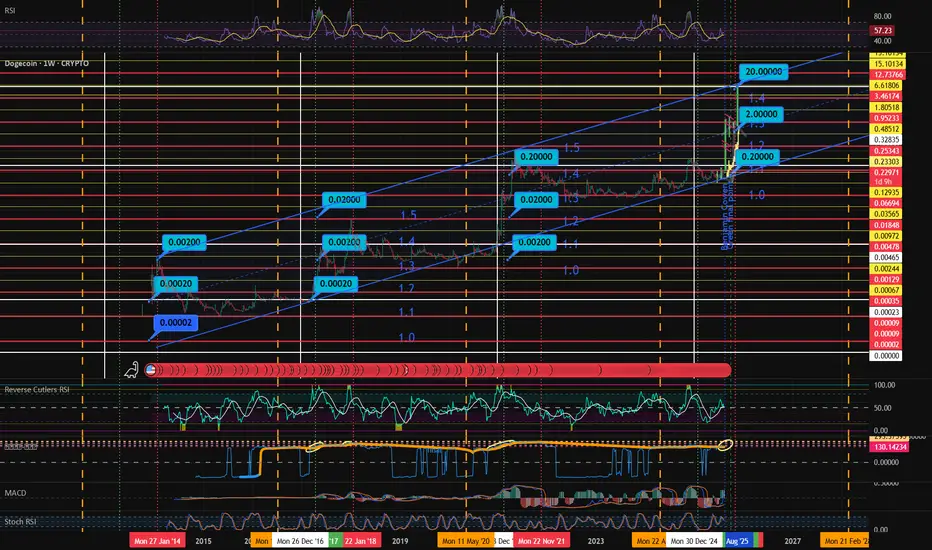
This chart displays Dogecoin (DOGE/USDT) on a weekly timeframe, highlighting its long-term price trend within an ascending channel since 2014. Key historical breakout levels are marked (e.g., $0.00002, $0.002, $0.02, $0.20, $2, and a projected $20 target), showing the repeating exponential growth cycles. The chart is overlaid with support and resistance zones, Fibonacci-like levels, and trend channels (1.0, 1.1, 1.2, 1.5). Vertical dotted and dashed lines mark important cycle dates and potential turning points. Current price action is consolidating near $0.23, with future targets extending to $2 and potentially $20 if the channel pattern continues.
Dagangan aktif

Follow me on
📥┃DiscorD Channel: discord.gg/SdJWdt3m to discuss in more depth.
📥┃X Account: x.com/DogeOlak to discuss in more depth.
📥┃DiscorD Channel: discord.gg/SdJWdt3m to discuss in more depth.
📥┃X Account: x.com/DogeOlak to discuss in more depth.
Penafian
Maklumat dan penerbitan adalah tidak bertujuan, dan tidak membentuk, nasihat atau cadangan kewangan, pelaburan, dagangan atau jenis lain yang diberikan atau disahkan oleh TradingView. Baca lebih dalam Terma Penggunaan.