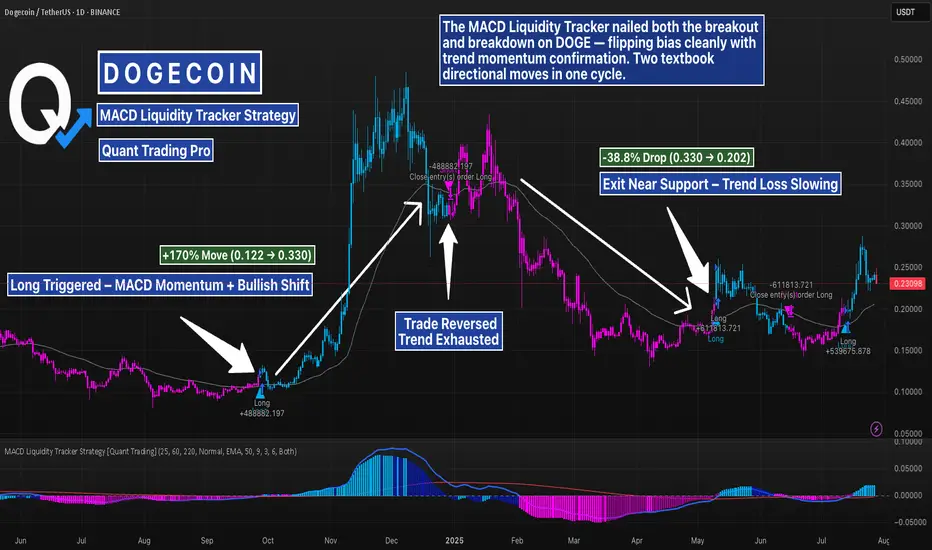
This DOGE 1D chart highlights two key directional shifts caught by the MACD Liquidity Tracker Strategy — a bullish breakout near $0.12 and a clean reversal near $0.33. The system flipped long once MACD momentum aligned with trend structure, and later rotated bearish as the trend exhausted.
Both moves were captured without guessing — using dynamic trend coloring and a momentum-backed entry logic. Visual bias (blue/pink) helps contextualize the trend at a glance, and the EMA filters reduce chop during sideways conditions.
To explore this setup yourself, search for the strategy by name and run your own backtests to refine inputs per asset and timeframe.
📊 Strategy Name:
MACD Liquidity Tracker Strategy [Quant Trading]
This is one of several strategy visualizations — more incoming.
Explore 5,000 Strategies at quanttradingpro.com
Search for the most profitable, lowest risk by symbol!
Search by indicators like Supertrend, Ichimoku, macd.
Join our discord discord.gg/2systG9frc
We provide education & tools.
Search for the most profitable, lowest risk by symbol!
Search by indicators like Supertrend, Ichimoku, macd.
Join our discord discord.gg/2systG9frc
We provide education & tools.
Penafian
The information and publications are not meant to be, and do not constitute, financial, investment, trading, or other types of advice or recommendations supplied or endorsed by TradingView. Read more in the Terms of Use.