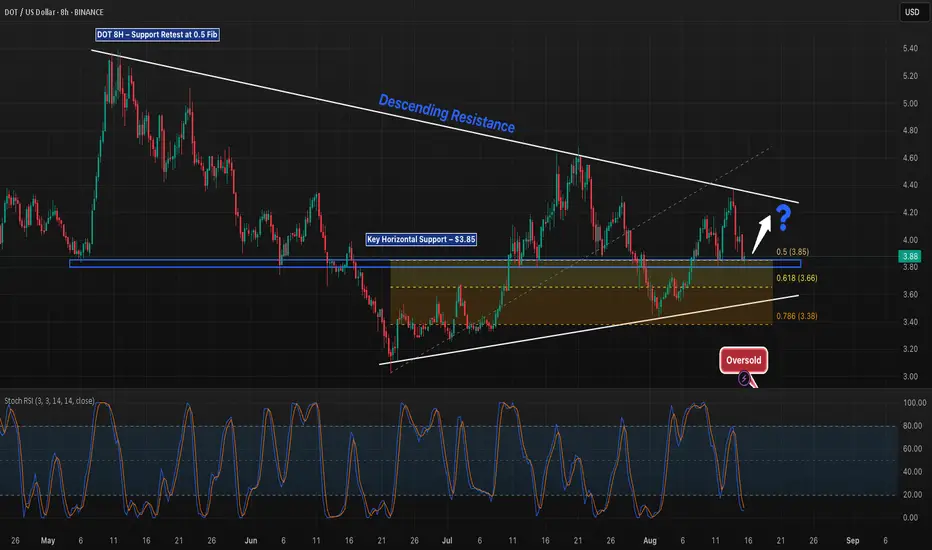
DOT is once again testing the $3.85 horizontal support, aligning with the 0.5 Fibonacci retracement from the recent swing low to high. A breakdown here opens the door to the $3.66 0.618 Fib and the $3.38 0.786 Fib, both of which align with the ascending trendline. On the upside, price faces descending resistance near $4.40, which has capped rallies since April. The Stoch RSI is oversold, suggesting possible short-term relief, but confirmation is needed to avoid a deeper retracement. Monitoring volume and reaction at $3.85 will be key for the next move.
Explore 5,000 Strategies at quanttradingpro.com
Search for the most profitable, lowest risk by symbol!
Search by indicators like Supertrend, Ichimoku, macd.
Join our discord discord.gg/2systG9frc
We provide education & tools.
Search for the most profitable, lowest risk by symbol!
Search by indicators like Supertrend, Ichimoku, macd.
Join our discord discord.gg/2systG9frc
We provide education & tools.
Penafian
Maklumat dan penerbitan adalah tidak dimaksudkan untuk menjadi, dan tidak membentuk, nasihat untuk kewangan, pelaburan, perdagangan dan jenis-jenis lain atau cadangan yang dibekalkan atau disahkan oleh TradingView. Baca dengan lebih lanjut di Terma Penggunaan.