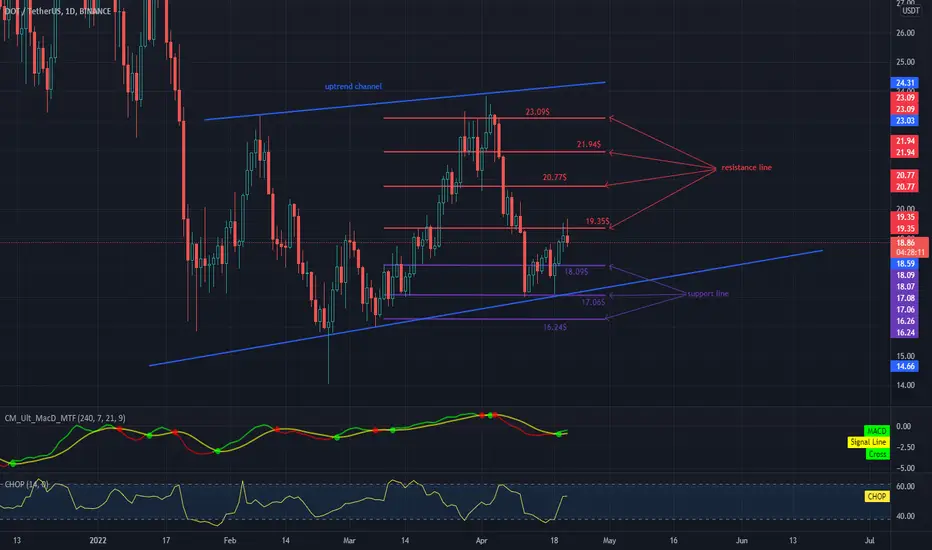
Hello everyone, let's take a look at the DOT to USDT chart over the 1 day timeframe. As you can see, the price is moving in an uptrend channel marked with blue lines.
Let's start by determining the support lines with the Trend-Based Fib Extension tool and as you can see, the first support in the near future is $ 18.09, if the support breaks down, the next ones are $ 17.06 and $ 16.24.
Now let's move from the resistance line as the first resistance is $ 19.35, if you can break it the next resistance will be $ 20.77 and $ 21.94 plus $ 23.09.
Looking at the CHOP indicator, we can see that in the 1-day range we are starting to gain more and more energy, and the MACD indicator shows that an uptrend has started.
Penafian
Maklumat dan penerbitan adalah tidak dimaksudkan untuk menjadi, dan tidak membentuk, nasihat untuk kewangan, pelaburan, perdagangan dan jenis-jenis lain atau cadangan yang dibekalkan atau disahkan oleh TradingView. Baca dengan lebih lanjut di Terma Penggunaan.
Penafian
Maklumat dan penerbitan adalah tidak dimaksudkan untuk menjadi, dan tidak membentuk, nasihat untuk kewangan, pelaburan, perdagangan dan jenis-jenis lain atau cadangan yang dibekalkan atau disahkan oleh TradingView. Baca dengan lebih lanjut di Terma Penggunaan.