📅  DOT is at a crucial juncture, with major structure overlap across timeframes.
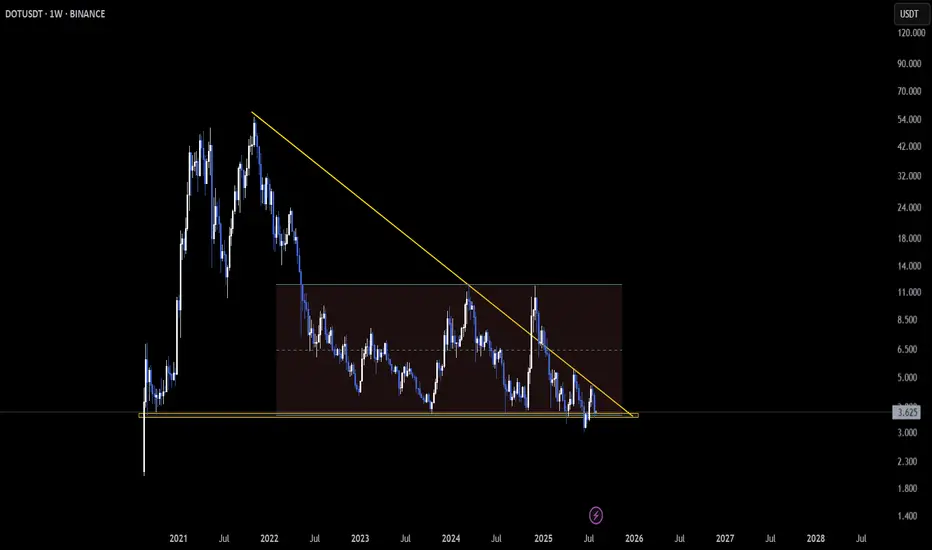
On the Weekly, price is testing support from a descending triangle 🛡️ — a level that has held multiple times in the past.
📆 Meanwhile, the Daily chart shows a falling wedge pattern forming 📐, a classic setup known for bullish reversals.
The confluence here adds weight — this is a zone where price often reacts.
👀 Bounce incoming or breakdown loading? This one deserves close attention.
What’s your take on the next move?
Not financial advice. DOTUSDT
On the Weekly, price is testing support from a descending triangle 🛡️ — a level that has held multiple times in the past.
📆 Meanwhile, the Daily chart shows a falling wedge pattern forming 📐, a classic setup known for bullish reversals.
The confluence here adds weight — this is a zone where price often reacts.
👀 Bounce incoming or breakdown loading? This one deserves close attention.
What’s your take on the next move?
Not financial advice.
I share more in my court
Join me on X: x.com/Coin_Mastermind
Join me on Telegram: t.me/coin_mastermind
Join me on X: x.com/Coin_Mastermind
Join me on Telegram: t.me/coin_mastermind
Penafian
The information and publications are not meant to be, and do not constitute, financial, investment, trading, or other types of advice or recommendations supplied or endorsed by TradingView. Read more in the Terms of Use.