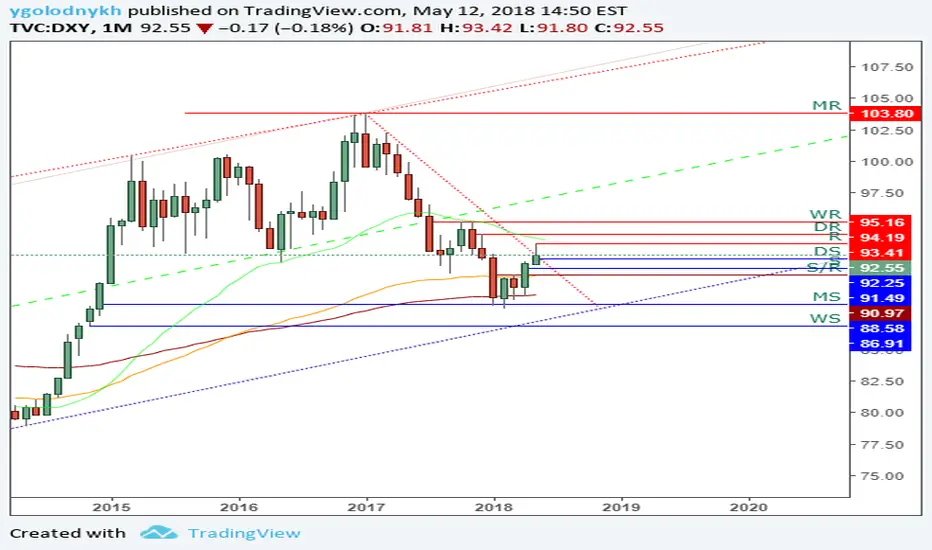
Price made contact with the 130 EMA at the beginning of 2018 creating a level of support around the 91.5 level. It also looks to be breaking out of the downtrend it was in for the majority of 2017. Price is currently testing a level that has acted as support in the past. If price can continue its bullish momentum and get above the 29 EMA this will confirm long-term bullish momentum. The level to watch here is 94. Will need lots of positive US data for this to happen. https://www.tradingview.com/x/Bf2qwRSH/
Penafian
Maklumat dan penerbitan adalah tidak dimaksudkan untuk menjadi, dan tidak membentuk, nasihat untuk kewangan, pelaburan, perdagangan dan jenis-jenis lain atau cadangan yang dibekalkan atau disahkan oleh TradingView. Baca dengan lebih lanjut di Terma Penggunaan.
Penafian
Maklumat dan penerbitan adalah tidak dimaksudkan untuk menjadi, dan tidak membentuk, nasihat untuk kewangan, pelaburan, perdagangan dan jenis-jenis lain atau cadangan yang dibekalkan atau disahkan oleh TradingView. Baca dengan lebih lanjut di Terma Penggunaan.
