Dynamatic Technologies Limited (DYNAMATECH) is trading in a strong uptrend near the upper end of its yearly range, but with stretched valuations and signs of momentum fatigue, so it suits disciplined, trend-following trades with tight risk rather than fresh aggressive entries.
## Price zone and trend
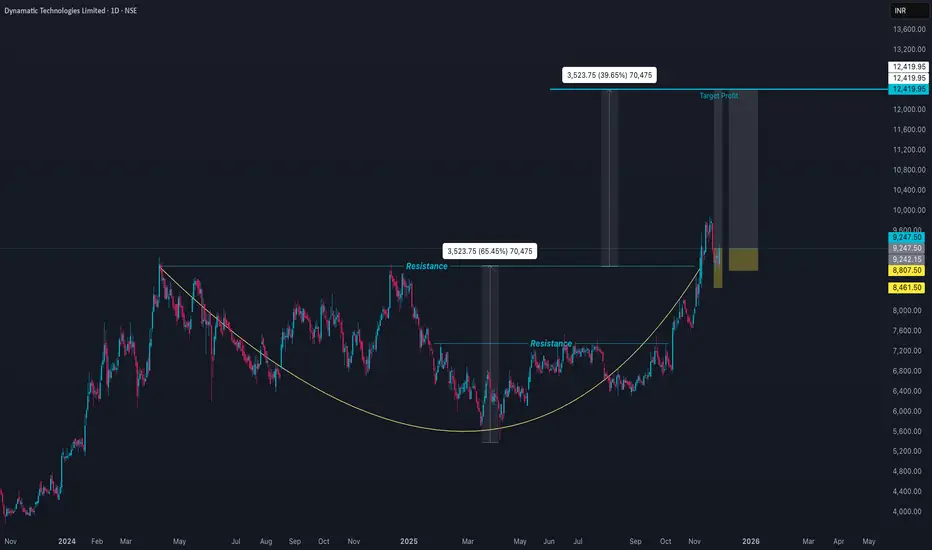
- Recent closes are around ₹9,100–9,300, after hitting a 52-week and all‑time high near ₹9,850 in November 2025, versus a 52‑week low near ₹5,440, which means price is holding in the top band of its yearly range and has already delivered strong multi‑month returns.
- Medium- to long-term structure remains bullish, with price above 50-, 100-, and 200-day moving averages on most analyses, indicating an established uptrend despite recent sideways-to-slightly corrective moves.
## Momentum and valuation
- RSI sits in the mid-30s, reflecting cooling momentum after the recent high rather than a full breakdown, while indicators like MACD lean short-term bearish even as ADX stays strong, a typical “trending but pausing” setup.[2][3]
- Valuation is rich, with trailing P/E well above 100x in some snapshots, signaling that a lot of future growth is already priced in and any earnings disappointment or macro shock could trigger sharp mean reversion.
## Key levels and trading view
- Immediate support lies in the ₹8,700–8,800 zone (recent swing and day’s low cluster), with deeper support toward ₹7,600 if correction extends, while resistance is around ₹9,800–9,900 and then psychological ₹10,000.
- For tactical trading, higher-probability setups are:
- Buying on dips toward support with confirmation (strong intraday rejection or volume pickup), targeting retests of the highs, and using tight stops just below the support band.
- Avoiding fresh longs on straight breakouts after vertical runs unless accompanied by clear volume expansion, and being cautious with shorts given the still-bullish higher timeframe trend and relatively low beta.
## Price zone and trend
- Recent closes are around ₹9,100–9,300, after hitting a 52-week and all‑time high near ₹9,850 in November 2025, versus a 52‑week low near ₹5,440, which means price is holding in the top band of its yearly range and has already delivered strong multi‑month returns.
- Medium- to long-term structure remains bullish, with price above 50-, 100-, and 200-day moving averages on most analyses, indicating an established uptrend despite recent sideways-to-slightly corrective moves.
## Momentum and valuation
- RSI sits in the mid-30s, reflecting cooling momentum after the recent high rather than a full breakdown, while indicators like MACD lean short-term bearish even as ADX stays strong, a typical “trending but pausing” setup.[2][3]
- Valuation is rich, with trailing P/E well above 100x in some snapshots, signaling that a lot of future growth is already priced in and any earnings disappointment or macro shock could trigger sharp mean reversion.
## Key levels and trading view
- Immediate support lies in the ₹8,700–8,800 zone (recent swing and day’s low cluster), with deeper support toward ₹7,600 if correction extends, while resistance is around ₹9,800–9,900 and then psychological ₹10,000.
- For tactical trading, higher-probability setups are:
- Buying on dips toward support with confirmation (strong intraday rejection or volume pickup), targeting retests of the highs, and using tight stops just below the support band.
- Avoiding fresh longs on straight breakouts after vertical runs unless accompanied by clear volume expansion, and being cautious with shorts given the still-bullish higher timeframe trend and relatively low beta.
Penafian
Maklumat dan penerbitan adalah tidak bertujuan, dan tidak membentuk, nasihat atau cadangan kewangan, pelaburan, dagangan atau jenis lain yang diberikan atau disahkan oleh TradingView. Baca lebih dalam Terma Penggunaan.
Penafian
Maklumat dan penerbitan adalah tidak bertujuan, dan tidak membentuk, nasihat atau cadangan kewangan, pelaburan, dagangan atau jenis lain yang diberikan atau disahkan oleh TradingView. Baca lebih dalam Terma Penggunaan.