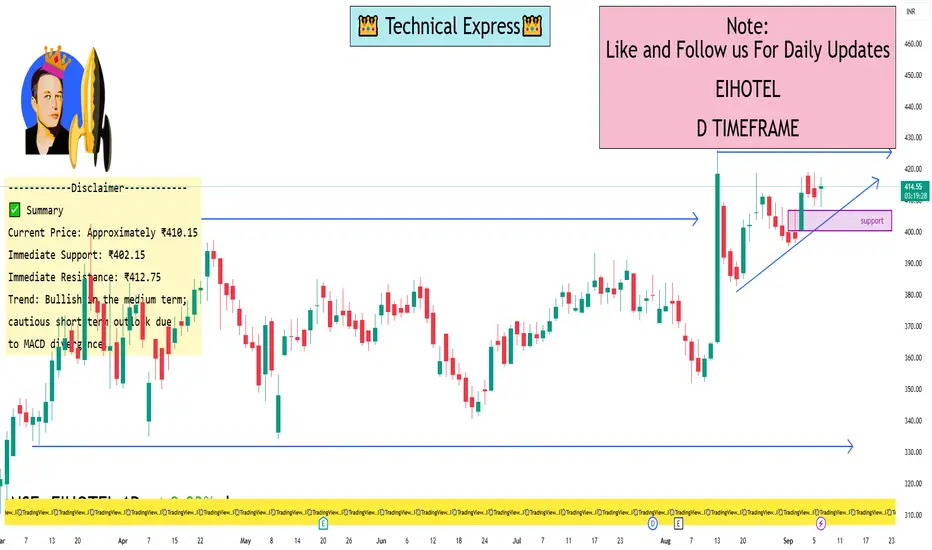
📈 Daily Support & Resistance Levels
Based on recent data, here are the critical levels:
Support Levels:
S1: ₹402.15
S2: ₹396.05
S3: ₹388.93
Resistance Levels:
R1: ₹412.75
R2: ₹417.25
R3: ₹423.35
These levels are derived from standard pivot point calculations and provide insight into potential price reversal zones.
🔍 Technical Indicators Overview
RSI (14-day): 55.79 – Neutral, indicating neither overbought nor oversold conditions.
MACD: 7.41 – Suggests a bearish trend, as the MACD line is above the signal line.
Moving Averages:
5-day EMA: ₹399.37 – Slightly below the current price, indicating a short-term bearish trend.
20-day EMA: ₹391.96 – Above the current price, suggesting medium-term bullish momentum.
50-day EMA: ₹381.97 – Above the current price, reinforcing the medium-term bullish outlook.
🧭 Trend Analysis
The stock is trading above its 20-day and 50-day EMAs, which typically indicates a bullish trend. However, the MACD suggests a potential short-term bearish phase. Traders should monitor the support and resistance levels closely for potential breakout or breakdown opportunities.
I built a Buy & Sell Signal Indicator with 85% accuracy.
📈 Get access via DM or
WhatsApp: wa.link/d997q0
Contact - +91 76782 40962
| Email: techncialexpress@gmail.com
| Script Coder | Trader | Investor | From India
📈 Get access via DM or
WhatsApp: wa.link/d997q0
Contact - +91 76782 40962
| Email: techncialexpress@gmail.com
| Script Coder | Trader | Investor | From India
Penerbitan berkaitan
Penafian
The information and publications are not meant to be, and do not constitute, financial, investment, trading, or other types of advice or recommendations supplied or endorsed by TradingView. Read more in the Terms of Use.