🔍 1. Understanding the Triple Bottom
The Triple Bottom is a classic bullish reversal pattern that typically forms after a prolonged downtrend or consolidation phase. It signifies strong buying interest at a consistent support level, leading to three distinct price lows (or “bottoms”) occurring near the same price zone.
📌 Key Characteristics:
📉 2. Triple Bottom Formed at ₹87–₹88 Zone
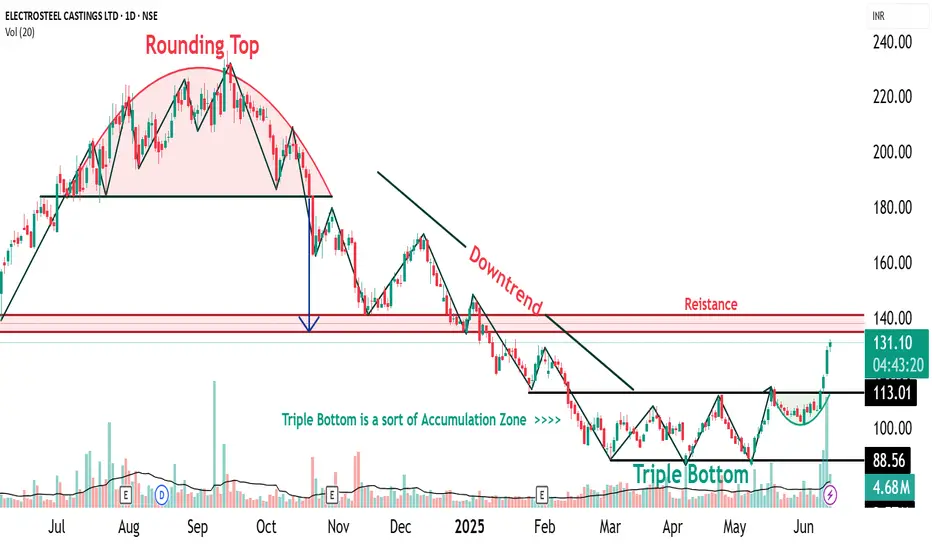
Electrosteel Castings has tested the ₹87–₹88 level three times, showing that this price zone has acted as a strong accumulation support. The repeated defense of this level suggests significant buying interest by institutional players or informed investors.
The pattern is visually symmetric and clean, enhancing its reliability.
At the third bottom near ₹87, a Morning Star was observed, marking the first visual confirmation of bullish reversal. This adds significant strength to the pattern because the third bottom often acts as a psychological pivot point, triggering buying from traders watching for a reversal.
📈 3. Higher Top – Higher Bottom Structure Emerging
Following the Morning Star, the stock has started forming a higher bottom and higher top structure—a fundamental trait of an uptrend. However:
🟡 Caution: One more higher bottom formation is required to confirm the start of a sustainable uptrend.
Once the uptrend is firmly established, a close above ₹140 will act as a major breakout signal, potentially propelling the price toward new 52-week highs or an all-time peak.
🧠 4. Accumulation Zone and Triple Bottom – The Relationship
An Accumulation Zone is a price range where informed investors quietly accumulate shares over a period, usually when a stock is undervalued or consolidating.
🔗 Connection to Triple Bottom:
Hence, the Triple Bottom is not just a technical pattern, but a visual representation of accumulation dynamics playing out.
📝 Disclaimer
This report is intended purely for educational and training purposes. It is not a recommendation to buy or sell securities. Always conduct your own research or consult a certified financial advisor before making trading decisions.
The Triple Bottom is a classic bullish reversal pattern that typically forms after a prolonged downtrend or consolidation phase. It signifies strong buying interest at a consistent support level, leading to three distinct price lows (or “bottoms”) occurring near the same price zone.
📌 Key Characteristics:
- Formation Time: Typically spans 2–6 months
- Touchpoints: Three distinct lows formed at or near the same support level
- Pattern Zone (for ELECTCAST): ₹87 – ₹88
- Trade Entry: Entry is typically considered on a breakout above the neckline, which is the horizontal resistance connecting the interim highs between the bottoms. In this case, a breakout confirmation would be around ₹96.
- Stop Loss (SL): Just below the third bottom, e.g., ₹85
- Target: Based on pattern depth projection, conservative ₹104, aggressive potential up to ₹120–₹140, once momentum sustains
📉 2. Triple Bottom Formed at ₹87–₹88 Zone
Electrosteel Castings has tested the ₹87–₹88 level three times, showing that this price zone has acted as a strong accumulation support. The repeated defense of this level suggests significant buying interest by institutional players or informed investors.
- 1st Bottom: Initial rejection near ₹88
*2nd Bottom: Retest with similar rejection zone
*3rd Bottom: Confluence with bullish reversal candlestick (Morning Star)
The pattern is visually symmetric and clean, enhancing its reliability.
At the third bottom near ₹87, a Morning Star was observed, marking the first visual confirmation of bullish reversal. This adds significant strength to the pattern because the third bottom often acts as a psychological pivot point, triggering buying from traders watching for a reversal.
📈 3. Higher Top – Higher Bottom Structure Emerging
Following the Morning Star, the stock has started forming a higher bottom and higher top structure—a fundamental trait of an uptrend. However:
🟡 Caution: One more higher bottom formation is required to confirm the start of a sustainable uptrend.
Once the uptrend is firmly established, a close above ₹140 will act as a major breakout signal, potentially propelling the price toward new 52-week highs or an all-time peak.
🧠 4. Accumulation Zone and Triple Bottom – The Relationship
An Accumulation Zone is a price range where informed investors quietly accumulate shares over a period, usually when a stock is undervalued or consolidating.
🔗 Connection to Triple Bottom:
- The Triple Bottom pattern often forms within the Accumulation Zone
- Each dip to the support level attracts buyers, revealing hidden demand
- The formation acts as a transition from accumulation to markup phase
- The breakout from the Triple Bottom signals the end of accumulation and the start of an uptrend
Hence, the Triple Bottom is not just a technical pattern, but a visual representation of accumulation dynamics playing out.
📝 Disclaimer
This report is intended purely for educational and training purposes. It is not a recommendation to buy or sell securities. Always conduct your own research or consult a certified financial advisor before making trading decisions.
Penafian
Maklumat dan penerbitan adalah tidak bertujuan, dan tidak membentuk, nasihat atau cadangan kewangan, pelaburan, dagangan atau jenis lain yang diberikan atau disahkan oleh TradingView. Baca lebih dalam Terma Penggunaan.
Penafian
Maklumat dan penerbitan adalah tidak bertujuan, dan tidak membentuk, nasihat atau cadangan kewangan, pelaburan, dagangan atau jenis lain yang diberikan atau disahkan oleh TradingView. Baca lebih dalam Terma Penggunaan.