Let’s analyze the chart of Electrosteel Castings  ELECTCAST through two distinct lenses:
1️⃣ Demand and Supply Theory
2️⃣ Traditional Technical Analysis
🧱 Smart Money Footprint: Demand & Supply Zone Perspective 🧱
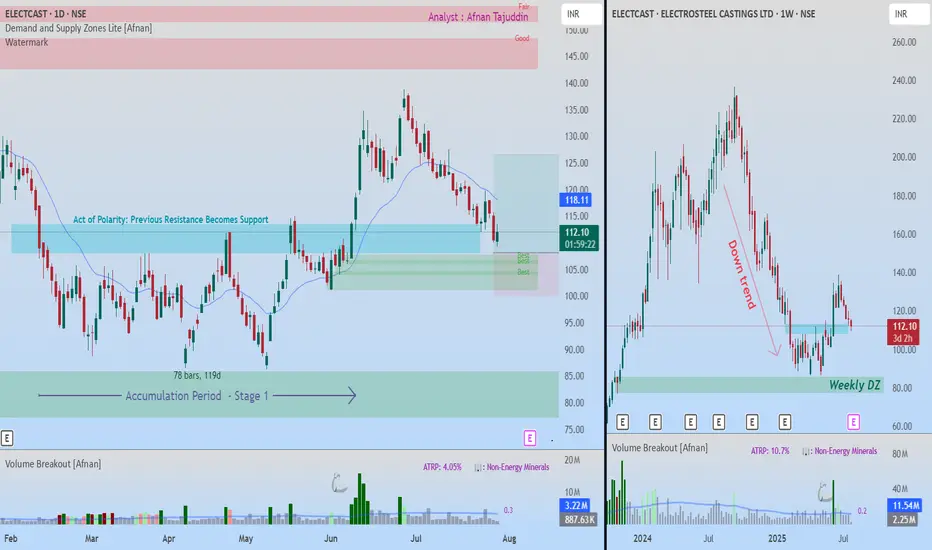
On the weekly chart, the price had been in a steady downtrend since September 2024. But then came a major reversal from a strong weekly demand zone.
This zone is not just a box on the chart — it’s a footprint of institutional smart money. Such zones often represent areas where:
🔹 Institutions previously placed large buy orders.
🔹 There may still be pending orders left unfilled.
🔹 Or, institutions may look to accumulate more, continuing their previous buying activity.
After the price hit this zone:
🔹It reacted sharply upward — a sign of strong demand.
🔹Then, it moved into sideways consolidation, forming a potential accumulation phase.
Zooming into the daily chart, this base was eventually broken with strength, confirming a trend shift.
Now, price is pulling back — and here’s what’s important:
🔹 There are three overlapping demand zones on the daily chart.
🔹 These form a “level-on-level” structure, meaning demand is stacked in layers.
🔹 While the height of these zones is small (good risk-reward), the structure shows deep, layered buying interest.
This pullback into a stacked demand zone — especially after a major trend reversal — is a classic smart money re-entry zone.
📈 Traditional Technical Analysis: Breakout and Retest 📈
Now let’s look at it from a conventional technical trader’s view:
On the weekly chart, the price had been in a sharp downtrend starting from September 2024. But eventually, the fall slowed, and price began consolidating.
Zooming into the daily chart, this consolidation phase lasted over 120 days — and it wasn’t just a pause, it was a full-fledged accumulation. Here’s why:
1️⃣ A well-defined base formed.
2️⃣ There was a spring pattern, where price briefly dipped lower to trap weak sellers.
3️⃣ Tight consolidation followed by a powerful breakout.
4️⃣ Most importantly — the breakout was backed by strong volume, confirming conviction.
After the breakout, price is now:
🔹 Pulling back toward the previous resistance — the ceiling of the accumulation zone.
🔹 That resistance is now acting as new support, forming a classic breakout retest setup.
This is what traditional traders love:
✅ Clear structure.
✅ Confirmed breakout.
✅ Pullback to a well-defined level.
🎯 Confluence = Confidence 🎯
Here’s where it all comes together:
🔁 The breakout retest level is also the exact region where three daily demand zones overlap.
🔁 That entire cluster sits above a major weekly demand zone.
🔁 Both demand-supply theory and traditional technical patterns agree: this is a high-probability reversal zone.
Such confluence adds significant weight to the idea that buyers may soon step in again.
⚠️ Final Thoughts ⚠️
This chart isn’t about prediction — it’s about preparation. When multiple theories agree at the same price point, it’s a sign to pay attention.
Lastly, Thank you for your support, your likes & comments. Feel free to ask if you have questions.
💡 Great trades aren’t rushed — they’re patiently waited for. Trust the process. 🎯📊
📝 This analysis is purely for educational purposes and is not intended as a trading or investment recommendation. I am not a SEBI registered analyst.
1️⃣ Demand and Supply Theory
2️⃣ Traditional Technical Analysis
🧱 Smart Money Footprint: Demand & Supply Zone Perspective 🧱
On the weekly chart, the price had been in a steady downtrend since September 2024. But then came a major reversal from a strong weekly demand zone.
This zone is not just a box on the chart — it’s a footprint of institutional smart money. Such zones often represent areas where:
🔹 Institutions previously placed large buy orders.
🔹 There may still be pending orders left unfilled.
🔹 Or, institutions may look to accumulate more, continuing their previous buying activity.
After the price hit this zone:
🔹It reacted sharply upward — a sign of strong demand.
🔹Then, it moved into sideways consolidation, forming a potential accumulation phase.
Zooming into the daily chart, this base was eventually broken with strength, confirming a trend shift.
Now, price is pulling back — and here’s what’s important:
🔹 There are three overlapping demand zones on the daily chart.
🔹 These form a “level-on-level” structure, meaning demand is stacked in layers.
🔹 While the height of these zones is small (good risk-reward), the structure shows deep, layered buying interest.
This pullback into a stacked demand zone — especially after a major trend reversal — is a classic smart money re-entry zone.
📈 Traditional Technical Analysis: Breakout and Retest 📈
Now let’s look at it from a conventional technical trader’s view:
On the weekly chart, the price had been in a sharp downtrend starting from September 2024. But eventually, the fall slowed, and price began consolidating.
Zooming into the daily chart, this consolidation phase lasted over 120 days — and it wasn’t just a pause, it was a full-fledged accumulation. Here’s why:
1️⃣ A well-defined base formed.
2️⃣ There was a spring pattern, where price briefly dipped lower to trap weak sellers.
3️⃣ Tight consolidation followed by a powerful breakout.
4️⃣ Most importantly — the breakout was backed by strong volume, confirming conviction.
After the breakout, price is now:
🔹 Pulling back toward the previous resistance — the ceiling of the accumulation zone.
🔹 That resistance is now acting as new support, forming a classic breakout retest setup.
This is what traditional traders love:
✅ Clear structure.
✅ Confirmed breakout.
✅ Pullback to a well-defined level.
🎯 Confluence = Confidence 🎯
Here’s where it all comes together:
🔁 The breakout retest level is also the exact region where three daily demand zones overlap.
🔁 That entire cluster sits above a major weekly demand zone.
🔁 Both demand-supply theory and traditional technical patterns agree: this is a high-probability reversal zone.
Such confluence adds significant weight to the idea that buyers may soon step in again.
⚠️ Final Thoughts ⚠️
This chart isn’t about prediction — it’s about preparation. When multiple theories agree at the same price point, it’s a sign to pay attention.
“The best opportunities don’t scream — they whisper, where smart money operates quietly.”
Lastly, Thank you for your support, your likes & comments. Feel free to ask if you have questions.
💡 Great trades aren’t rushed — they’re patiently waited for. Trust the process. 🎯📊
📝 This analysis is purely for educational purposes and is not intended as a trading or investment recommendation. I am not a SEBI registered analyst.
Access the powerful Demand and Supply Zone Pro indicator at:
marketup2date.com
Stay updated on Telegram:
t.me/MarketUp2Date
Join our WhatsApp channel:
whatsapp.com/channel/0029Va6ByyH0LKZCc4Az4x0u
marketup2date.com
Stay updated on Telegram:
t.me/MarketUp2Date
Join our WhatsApp channel:
whatsapp.com/channel/0029Va6ByyH0LKZCc4Az4x0u
Penerbitan berkaitan
Penafian
Maklumat dan penerbitan adalah tidak bertujuan, dan tidak membentuk, nasihat atau cadangan kewangan, pelaburan, dagangan atau jenis lain yang diberikan atau disahkan oleh TradingView. Baca lebih dalam Terma Penggunaan.