Price Action:
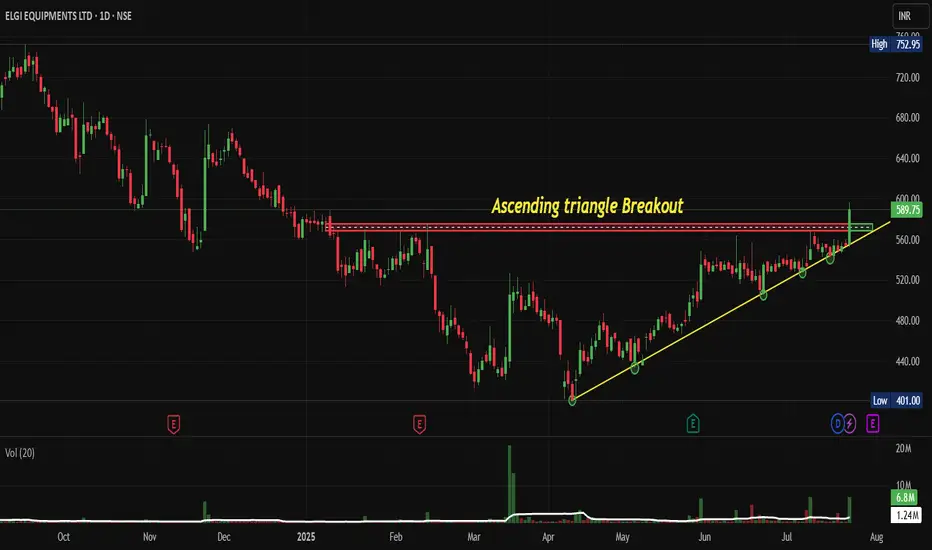
- Current Price: ₹589.75 (as of chart date)
- 52-Week High: ₹752.95
- 52-Week Low: ₹401.00
- Daily Change: +₹35.95 (+6.41%)
- Market Cap: ₹18,703 Cr.
Volume Spread Analysis:
Volume Profile Assessment:
- Breakout Volume: 6.8M shares (significantly above average)
- Volume Trend: Increasing volume during breakout phase
- Volume-Price Relationship: Positive correlation during an uptrend
- Distribution vs Accumulation: Clear accumulation pattern visible
Volume Indicators:
- 20-day Average Volume: 1.24M shares
- Breakout Volume Confirmation: Yes (above average volume)
- Volume Concentration: Higher volumes at support levels indicate buying interest
My Key Technical Observations:
- Stock has successfully broken out from a major ascending triangle pattern
- Strong volume confirmation on the breakout day
- Price action showing momentum acceleration after months of consolidation
- Clear trend reversal from the March 2025 lows
Pattern Recognition and Structure Analysis:
Primary Pattern: Ascending Triangle Breakout
- Formation Period: Jan 2025 to July 2025 (7 months)
- Resistance Level: ₹570-580 (horizontal resistance)
- Support Trendline: Rising from ₹401 lows in March 2025
- Breakout Confirmation: Volume spike accompanying price breakout
- Pattern Target: ₹680-700 (measuring the height of the triangle base)
Secondary Patterns:
- Double Bottom formation at ₹401 levels (March 2025)
- Flag and pennant consolidations during the uptrend
- Higher highs and higher lows structure since March 2025
Key Support and Resistance:
Key Resistance Levels:
- Immediate Resistance: ₹600-610 (psychological level)
- Major Resistance: ₹650-680 (pattern target zone)
- 52 Week High Resistance: ₹750-755 (previous swing high)
Key Support Levels:
- Immediate Support: ₹560-570 (breakout level, now support)
- Strong Support: ₹520-530 (previous consolidation zone)
- Major Support: ₹480-490 (ascending trendline support)
- Critical Support: ₹440-450 (50% retracement of current move)
Base Formation Analysis:
- Primary Base: ₹480-580 consolidation zone (7 months)
- Base Characteristics: Tight consolidation with reduced volatility
- Base Quality: High-quality base with multiple retests of support/resistance
- Accumulation Evidence: Consistent volume during the consolidation phase
Trade Setup and Entry Strategy:
Primary Trade Setup - Momentum Play:
- Entry Strategy: Buy on pullback to ₹570-575 (breakout retest)
- Alternative Entry: Current levels for aggressive traders
- Entry Rationale: Ascending triangle breakout with volume confirmation
Secondary Trade Setup - Swing Trade:
- Entry Strategy: Accumulate on dips to the ₹520-530 zone
- Entry Rationale: Strong support zone with multiple bounce history
- Time Horizon: 3-6 months
Entry Levels and Execution:
Aggressive Entry (Short-term):
- Entry Price: ₹585-590 (current market price)
- Quantity: 30% of planned position
- Rationale: Momentum continuation play
Conservative Entry (Medium-term):
- Entry Price: ₹570-575 (breakout retest)
- Quantity: 50% of the planned position
- Rationale: Better risk-reward ratio
Value Entry (Long-term):
- Entry Price: ₹520-530 (support zone)
- Quantity: 70% of planned position
- Rationale: High probability support zone
Exit Levels and Profit Targets:
Short-term Targets (1-3 months):
- Target 1: ₹620-630 (5-7% upside from current levels)
- Target 2: ₹650-660 (10-12% upside)
- Target 3: ₹680-690 (pattern target)
Medium-term Targets (3-12 months):
- Target 1: ₹700-720 (psychological resistance)
- Target 2: ₹750-760 (52 Week high retest)
- Target 3: ₹800-820 (extension target)
Exit Strategy:
- Partial Profit Taking: 25% at each target level
- Trailing Stop: Implement after reaching the first target
- Final Exit: Technical breakdown below key support
Stop-Loss Strategy:
Initial Stop-Loss Levels:
- Aggressive Traders: ₹555 (5% below entry)
- Conservative Traders: ₹530 (below support zone)
- Long-term Investors: ₹480 (below ascending trendline)
Stop-Loss Management:
- Initial Risk: 5-10% of entry price
- Trailing Strategy: Move stop-loss to breakeven after 5% profit
- Progressive Tightening: Reduce stop distance as price advances
Position Sizing and Risk Management:
Position Sizing Framework:
- Conservative Approach: 2-3% of portfolio
- Moderate Approach: 3-5% of portfolio
- Aggressive Approach: 5-7% of portfolio
Risk Management Rules:
- Maximum Risk per Trade: 2% of total capital
- Risk-Reward Ratio: Minimum 1:2 for all trades
- Portfolio Concentration: Maximum 10% in a single stock
- Sector Exposure: Maximum 20% in the capital goods sector
Capital Allocation Strategy:
- 30% on initial breakout entry
- 40% on pullback to support
- 30% reserved for additional weakness
Sectoral Backdrop:
Capital Goods Sector Overview:
- Sector Performance: Outperforming broader markets in 2025
- Government Support: PLI schemes boosting manufacturing
- Infrastructure Push: Continued focus on industrial development
- Export Opportunities: Growing global demand for Indian machinery
Industrial Compressor Market Dynamics:
- Market Size: India air compressor market valued at $1.09 billion (2023)
- Growth Projection: Expected to reach $1.64 billion by 2030
- CAGR: 5.4% growth from 2024 to 2030
- Volume Growth: From 64,000 units (2023) to 120,000 units (2030)
Manufacturing Sector Tailwinds:
- Target Achievement: Manufacturing sector expected to reach $1 trillion by 2025
- Industrial Growth: Rapid expansion in the automotive and electronics sectors
- Policy Support: Make in India and PLI schemes driving demand
- Infrastructure Development: Continued capex cycle supporting industrial equipment demand
Fundamental Backdrop:
Company Overview:
- Business: Leading manufacturer of air compressors and pneumatic tools
- Market Position: Strong presence in the industrial compressor segment
- Product Range: Oil-lubricated piston compressors, reciprocating compressors
- Employee Strength: 2,172 employees
Financial Highlights:
- Market Capitalization: ₹ 18,703 Cr.
- EPS (TTM): ₹11.05
- Book Value per Share: ₹58.90
- Price to Book Ratio: 10
- Dividend Yield: 0.37%
Recent Performance:
- Q4 FY25 Revenue: ₹ 993 crore
- Q4 FY25 Net Profit: ₹102.00 crore
- Annual Revenue (FY25): ₹3,510 crore
- Annual Net Profit (FY25): ₹350 crore
Earnings Outlook:
- Next Earnings Report: July 30, 2025 (Expected)
- Annual General Meeting: August 12, 2025 (Expected)
- Dividend Declared: ₹2.20 per share for FY25
- Management Assessment: Economic quality in terms of earnings and margins
Risk Factors and Considerations:
Technical Risks:
- False Breakout Risk: Potential failure to sustain above resistance
- Market Correlation: High correlation with broader market movements
- Sector Rotation: Risk of funds moving away from capital goods
- Volume Sustainability: Need for continued volume support
Fundamental Risks:
- Economic Slowdown: Impact on industrial capex cycles
- Competition Intensity: Pressure from domestic and international players
- Raw Material Costs: Inflation in steel and component prices
- Export Dependency: Global economic uncertainty affecting demand
Market Risks:
- Interest Rate Sensitivity: Impact of monetary policy changes
- Currency Fluctuation: Export revenue exposure to forex volatility
- Regulatory Changes: Potential policy modifications affecting industry
- Liquidity Risk: Lower institutional participation during market stress
My Take:
The risk-reward profile appears favourable for both short-term momentum traders and long-term investors, with multiple entry strategies catering to different risk appetites. However, proper position sizing and disciplined stop-loss management remain crucial for the successful execution of this trade setup.
Keep in the Watchlist and DOYR.
NO RECO. For Buy/Sell.
📌Thank you for exploring my idea! I hope you found it valuable.
🙏FOLLOW for more
👍BOOST if you found it useful.
✍️COMMENT below with your views.
Meanwhile, check out my other stock ideas on the right side until this trade is activated. I would love your feedback.
Disclaimer: "I am not a SEBI REGISTERED RESEARCH ANALYST AND INVESTMENT ADVISER."
This analysis is intended solely for informational and educational purposes and should not be interpreted as financial advice. It is advisable to consult a qualified financial advisor or conduct thorough research before making investment decisions.
Penerbitan berkaitan
Penafian
Maklumat dan penerbitan adalah tidak bertujuan, dan tidak membentuk, nasihat atau cadangan kewangan, pelaburan, dagangan atau jenis lain yang diberikan atau disahkan oleh TradingView. Baca lebih dalam Terma Penggunaan.
Penerbitan berkaitan
Penafian
Maklumat dan penerbitan adalah tidak bertujuan, dan tidak membentuk, nasihat atau cadangan kewangan, pelaburan, dagangan atau jenis lain yang diberikan atau disahkan oleh TradingView. Baca lebih dalam Terma Penggunaan.