🔎 Chart Summary
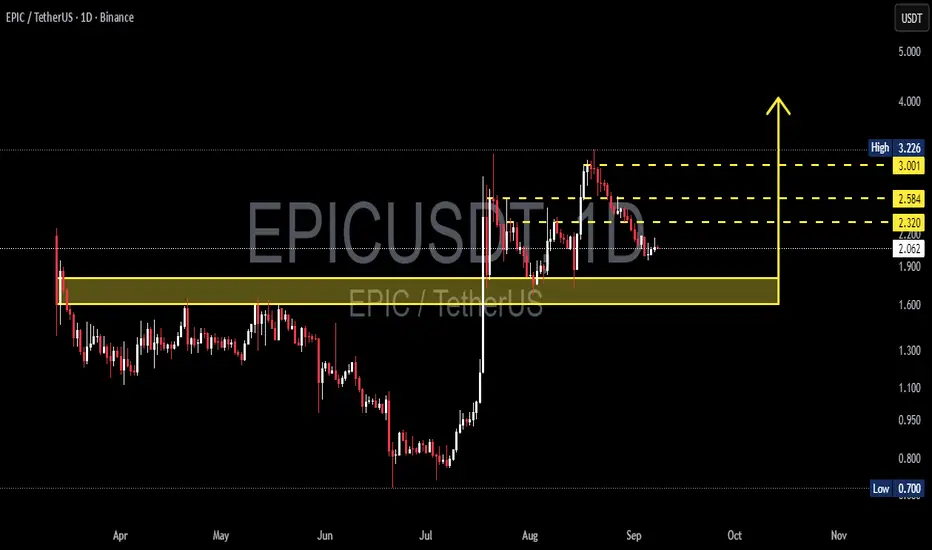
EPIC/USDT is currently in a distribution phase after a strong parabolic rally during mid-July – August. After hitting a local high of 3.22, price started forming lower highs, showing gradual selling pressure, and is now trading around 2.06.
The key battleground lies in the 1.55–1.75 demand zone (yellow box) — this zone will decide whether price consolidates for another leg up, or breaks down for a deeper correction.
---
🔑 Key Technical Levels
Current Price: 2.065
Immediate Resistances: 2.320 → 2.584 → 3.001 → 3.226 (High)
Major Support (Demand Zone): 1.55 – 1.75
Extreme Long-Term Support: 0.700 (historical low)
---
📌 Pattern & Market Structure
Pre-rally phase: Sideways accumulation (March – June) around 1.0–1.7.
July → August: Parabolic breakout with massive impulse.
After the pump: Market entered distribution/sideways range between ~1.9–3.2, with multiple rejections near 3.0+.
Current daily candles show lower highs, indicating weakening bullish momentum.
Overall, the setup resembles a distribution range rather than a clean bullish continuation, leaving the market in a neutral-to-bearish bias unless confirmed otherwise.
---
🟢 Bullish Scenario
Confirmation: Daily close above 2.32 + successful retest as support.
Targets:
TP1: 2.58
TP2: 3.00
TP3: 3.22 (previous high)
Invalidation: Daily close back below 1.95 or breakdown under 1.75.
Reasoning: Breakout above 2.32 signals buyers regaining control, opening room to retest major resistance zones.
---
🔴 Bearish Scenario
Confirmation: Daily close below 1.90, followed by a breakdown of the 1.55–1.75 demand zone.
Targets:
TP1: 1.20–1.10
TP2: 0.70 (in case of a full capitulation)
Invalidation: Price regains 2.32 with strong volume confirmation.
Reasoning: Failure to hold the demand zone confirms distribution phase is over, leading into a markdown phase.
---
📈 Strategy & Risk Management
Use 2.32 (resistance) and 1.75 (demand zone) as decision points.
Wait for confirmed breakout/retest before entering — avoid chasing price.
Risk only 1–2% per trade and size positions accordingly.
Use partial take-profit strategy: lock gains at 2.58, let runners ride to 3.0+.
Always track volume: weak breakouts without volume = high risk of false moves.
---
🧩 Conclusion
EPIC/USDT is at a critical crossroads:
Holding above 1.75 and breaking 2.32 would trigger a bullish continuation towards 2.58–3.00.
Losing the 1.55–1.75 demand zone could drag the market back to 1.20 or even 0.70.
This is a decisive moment for swing traders and mid-term investors to watch closely.
---
#EPIC #EPICUSDT #CryptoAnalysis #Altcoin #SwingTrading #TechnicalAnalysis #CryptoBreakout #PriceAction #SupportResistance
✅ Get Free Signals! Join Our Telegram Channel Here: t.me/TheCryptoNuclear
✅ Twitter: twitter.com/crypto_nuclear
✅ Join Bybit : partner.bybit.com/b/nuclearvip
✅ Benefits : Lifetime Trading Fee Discount -50%
✅ Twitter: twitter.com/crypto_nuclear
✅ Join Bybit : partner.bybit.com/b/nuclearvip
✅ Benefits : Lifetime Trading Fee Discount -50%
Penafian
Maklumat dan penerbitan adalah tidak dimaksudkan untuk menjadi, dan tidak membentuk, nasihat untuk kewangan, pelaburan, perdagangan dan jenis-jenis lain atau cadangan yang dibekalkan atau disahkan oleh TradingView. Baca dengan lebih lanjut di Terma Penggunaan.