Hi everyone,
I did not publish a new idea on ES yesterday, since the price action was following the expected path perfectly and I only added the following update to the idea of August 12th:

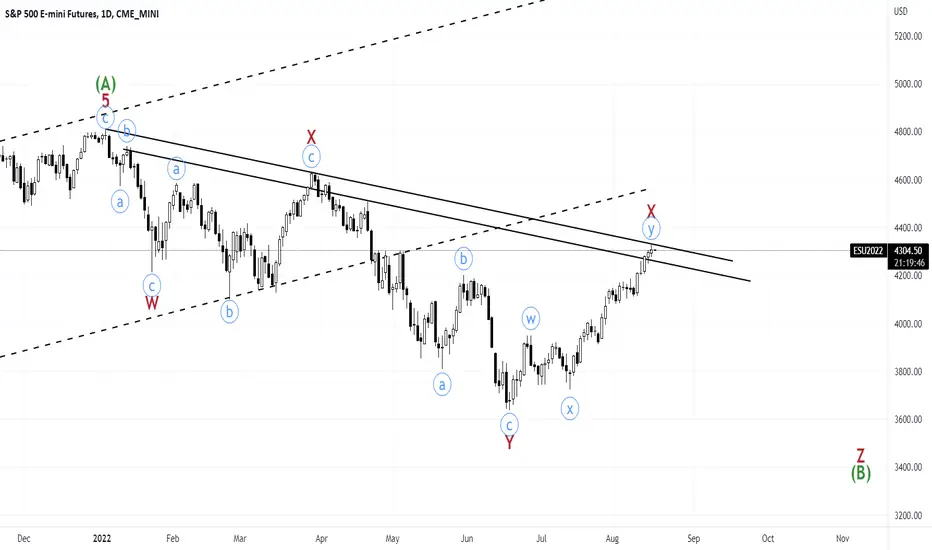
Overview: since August 11th, we were expecting that we are in wave V of (c) of y of X. As a potential target for wave X peak, I refer to my August 11th update: "Right now, I see us extending in wave V of (c) of y of X. Potential targets for wave X peak (4290-4310)."
Update: I believe that market peaked today. What is my reasoning for this claim?
Note: in case that wave V of (c) of y of X is still not completed and we make a higher high, I don't expect that high to be more than 4340 (I am considering a very low chance for this scenario at the moment.)
The only reason that I am considering this scenario is based on the hourly chart of appl, where I am still expecting a higher high on that name. This can lead to the same thing that happened on March 30th, 2022, where aapl made a higher high in that day, while spy did not.
I did not publish a new idea on ES yesterday, since the price action was following the expected path perfectly and I only added the following update to the idea of August 12th:
Overview: since August 11th, we were expecting that we are in wave V of (c) of y of X. As a potential target for wave X peak, I refer to my August 11th update: "Right now, I see us extending in wave V of (c) of y of X. Potential targets for wave X peak (4290-4310)."
Update: I believe that market peaked today. What is my reasoning for this claim?
- The same hourly count that I was updating since August 11th is now showing a complete structure for wave V of (c) of y of X.
- The high of today was 4327.5, which is aligned with several fib ratios: for example, a target for wave (5) was 4329.75 or a price target for wave C was 4329.
- The 200SMA on the daily chart can act as a strong pivot, which was at 4322.44 today and rejected the price nicely.
Note: in case that wave V of (c) of y of X is still not completed and we make a higher high, I don't expect that high to be more than 4340 (I am considering a very low chance for this scenario at the moment.)
The only reason that I am considering this scenario is based on the hourly chart of appl, where I am still expecting a higher high on that name. This can lead to the same thing that happened on March 30th, 2022, where aapl made a higher high in that day, while spy did not.
Penerbitan berkaitan
Penafian
Maklumat dan penerbitan adalah tidak bertujuan, dan tidak membentuk, nasihat atau cadangan kewangan, pelaburan, dagangan atau jenis lain yang diberikan atau disahkan oleh TradingView. Baca lebih dalam Terma Penggunaan.
Penerbitan berkaitan
Penafian
Maklumat dan penerbitan adalah tidak bertujuan, dan tidak membentuk, nasihat atau cadangan kewangan, pelaburan, dagangan atau jenis lain yang diberikan atau disahkan oleh TradingView. Baca lebih dalam Terma Penggunaan.