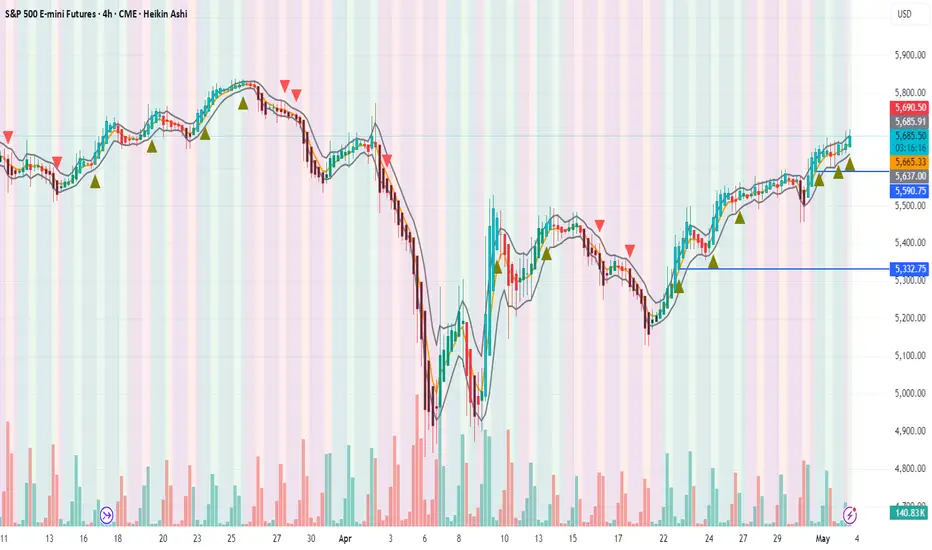
📢 The iSpark Indicator caught a strong breakout on the S&P 500 Index (4H chart) around the 5330 level, which was followed by a sequence of bullish moves — now reaching the 5700 mark.
🔍 Currently, price is testing the 10 EMA at 5710, which is acting as a short-term resistance. A clear break and sustained move above 5710 could trigger the next leg higher toward 5750–5775.
🎯 Holding positions? Stay in with a stop-loss at 5600 to manage risk.
📉 Fundamental caution: As always, keep an eye on macro headlines — unexpected global turmoil or sharp trade commentary (e.g., tariffs) may influence momentum
💡 This entire setup was captured early using the iSpark Indicator, designed to detect high-conviction breakouts across timeframes.
📬 Premium users interested in testing the iSpark Indicator can DM me for a hands-on walkthrough.
#SP500 #ES1! #Breakout #iSpark #TechnicalAnalysis #TradingStrategy #EMA #TrendFollowing #SPX #TradingView #SNP500
Dagangan aktif
All Targets' Achieved, Fresh Targets Open Now 5850++Penafian
Maklumat dan penerbitan adalah tidak bertujuan, dan tidak membentuk, nasihat atau cadangan kewangan, pelaburan, dagangan atau jenis lain yang diberikan atau disahkan oleh TradingView. Baca lebih dalam Terma Penggunaan.
Penafian
Maklumat dan penerbitan adalah tidak bertujuan, dan tidak membentuk, nasihat atau cadangan kewangan, pelaburan, dagangan atau jenis lain yang diberikan atau disahkan oleh TradingView. Baca lebih dalam Terma Penggunaan.