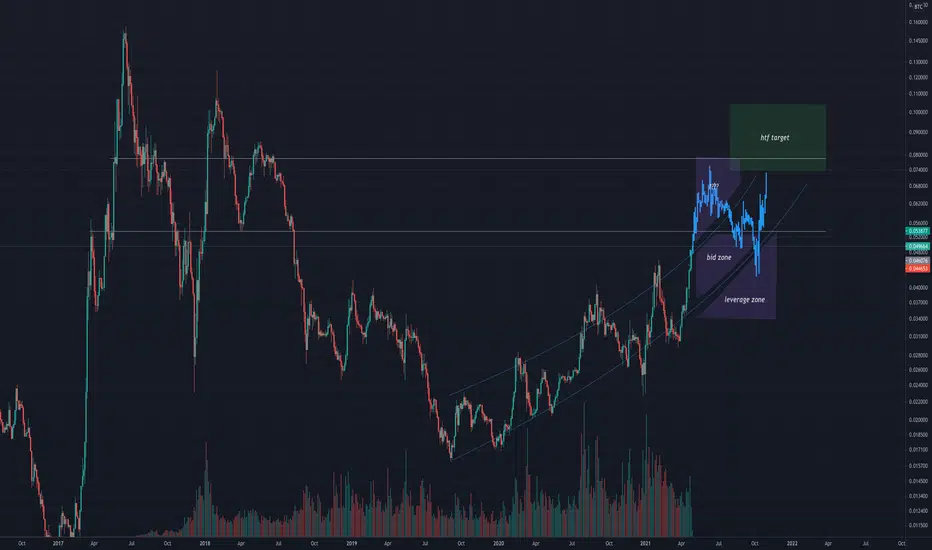
Long overdue retest of the 0.1 level upcoming over the next few months IMO, however expecting lots of chop between then.
I first drew the parabolic support channel back in mid-march (see linked idea), and it held as HTF support on the recent lows. For this chart, the upper channel has been added, but the lower channel is the same as the linked idea.
I think the thing to watch is how PA reacts to the upper channel, and if it can flip support/overextend as drawn, or re-enters the channel for further consolidation (also likely).
The blue bar extension pattern is from the previous cycle expansion 2-3 months ago, and is a rough idea of the PA to expect. Not necessarily expecting an overextension above the channel on this range, but that would be validation in my eyes of this overall thesis, even if price trades back in the range before an overextension outside the channel.
Curious to hear thoughts, posting for accountability my own education.
Nota
looking goodmay swap some spot ETH to BTC if there is weakness @ + subsequent retest/failure of the 0.78-0.8 level
if weakness shows before then, or there is a rejection in the next few days and lack of retest, would look to bid 0.49-0.55 w/ spot-margin
Nota
^^ freudian slip on those decimals ;) -- div ETH/BTC price by 10 therewould like to throw out there I believe there is a small chance ETH goes thermonuclear above 0.08 and completely destroys and invalidates the time/price-range of this chart (to the upside lol)
Penerbitan berkaitan
Penafian
Maklumat dan penerbitan adalah tidak dimaksudkan untuk menjadi, dan tidak membentuk, nasihat untuk kewangan, pelaburan, perdagangan dan jenis-jenis lain atau cadangan yang dibekalkan atau disahkan oleh TradingView. Baca dengan lebih lanjut di Terma Penggunaan.
Penerbitan berkaitan
Penafian
Maklumat dan penerbitan adalah tidak dimaksudkan untuk menjadi, dan tidak membentuk, nasihat untuk kewangan, pelaburan, perdagangan dan jenis-jenis lain atau cadangan yang dibekalkan atau disahkan oleh TradingView. Baca dengan lebih lanjut di Terma Penggunaan.