Key Insights on Ethereum's 4-Hour Chart
As of October 19, 2025, Ethereum (ETH) is trading around $3,900, reflecting a period of consolidation after recent volatility, with analysis suggesting a balanced but potentially bullish setup if key resistances are broken.
The 4-hour chart shows a descending wedge pattern, which often signals a reversal; research indicates this could lead to upward momentum toward $4,400–$4,600 if ETH closes above $4,000–$4,100, though downside risks remain if support fails.
Indicators like RSI and MACD are neutral, leaning toward caution, while on-chain metrics such as declining exchange reserves and whale accumulation point to underlying strength, making a rally to $4,500 plausible by month's end amid broader market recovery.
Evidence leans toward a range-bound scenario in the short term, with potential for volatility expansion; traders should monitor for confirmed breakouts to avoid false moves.
Current Price and Recent Action
Ethereum's price stands at approximately $3,892 USD, with a slight 24-hour increase of about 0.6% from recent lows. Over the last few 4-hour candles, ETH has shown mild oscillation, rebounding from supports near $3,860 but facing rejection at higher levels, indicating indecision among buyers and sellers.
Key Patterns and Trends
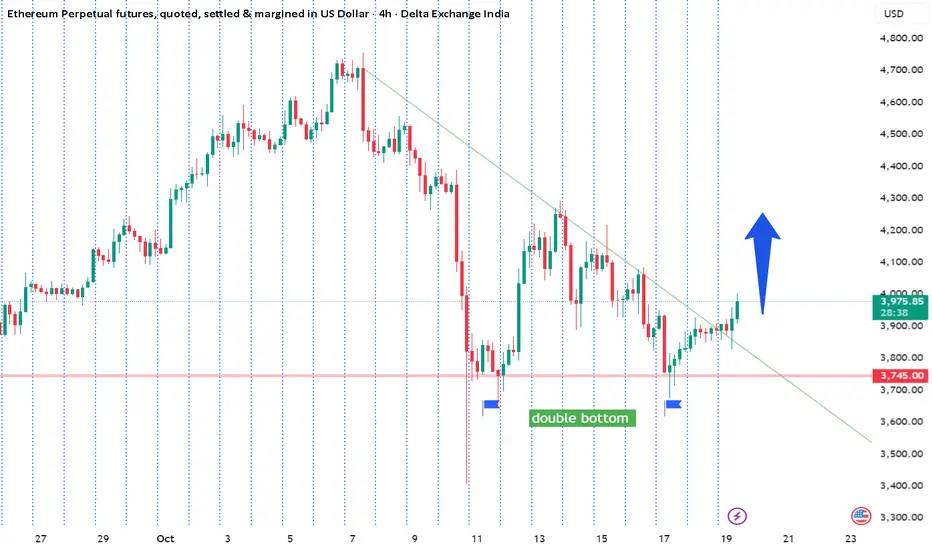
On the 4-hour timeframe, ETH is forming a descending wedge, characterized by lower highs and lows converging toward a point near the $3,400–$3,500 demand zone. This pattern follows a sharp pullback from $4,200, suggesting compression that could resolve bullishly. Broader trends show ETH stabilizing after a 15% rebound from $3,435, aligning with daily bull flag formations that support upward bias if momentum builds.
Risks and Outlook
While the setup appears constructive, it remains at risk below critical resistances; a failure to hold $3,700 could expose lower supports. On-chain data offers optimism, with MVRV ratios at historical support levels hinting at rallies, but external factors like market sentiment could influence outcomes.
Price Action and Historical Context
Recent price action on the 4H chart reveals a series of lower highs and lows following a rejection from the $4,200 breakdown zone earlier in October. Over the last 10-20 candles, ETH has oscillated within a tight range, with bullish candles attempting rebounds from supports around $3,860 but facing consistent selling pressure near $3,930–$3,950. This follows a sharper decline from mid-October peaks near $4,500, where volume spiked during pullbacks, indicating profit-taking or liquidation events. Volume trends show a 24-hour trading volume of approximately $23.36 billion, with a volume-to-market-cap ratio of 0.1019, suggesting moderate liquidity but no explosive buying yet.
Historically, ETH has shown resilience at these levels; for instance, the all-time high reached $4,955 on August 23, 2025, before correcting. Year-to-date, ETH is up 46.95%, but the recent 15% rebound from a two-month low of $3,435 highlights a V-shaped recovery pattern, supported by institutional demand zones. Contrasting views from analysts note that while short-term weakness persists (e.g., from $4,450–$4,500 resistance), the structure remains intact for potential upside if global sentiment
Chart Patterns and Structures
The dominant pattern on the 4H timeframe is a descending wedge, formed after the rejection from $4,200, with converging trendlines indicating compression between buyers and sellers. The lower boundary aligns with the $3,400–$3,500 institutional demand zone, while the upper trendline coincides with resistance at $4,000–$4,100. This setup is often bullish, as wedges typically resolve upward, but confirmation requires a close above the descending trendline.
The 4-hour chart shows a descending wedge pattern, which often signals a reversal; research indicates this could lead to upward momentum toward $4,400–$4,600 if ETH closes above $4,000–$4,100, though downside risks remain if support fails.
Indicators like RSI and MACD are neutral, leaning toward caution, while on-chain metrics such as declining exchange reserves and whale accumulation point to underlying strength, making a rally to $4,500 plausible by month's end amid broader market recovery.
Evidence leans toward a range-bound scenario in the short term, with potential for volatility expansion; traders should monitor for confirmed breakouts to avoid false moves.
Current Price and Recent Action
Ethereum's price stands at approximately $3,892 USD, with a slight 24-hour increase of about 0.6% from recent lows. Over the last few 4-hour candles, ETH has shown mild oscillation, rebounding from supports near $3,860 but facing rejection at higher levels, indicating indecision among buyers and sellers.
Key Patterns and Trends
On the 4-hour timeframe, ETH is forming a descending wedge, characterized by lower highs and lows converging toward a point near the $3,400–$3,500 demand zone. This pattern follows a sharp pullback from $4,200, suggesting compression that could resolve bullishly. Broader trends show ETH stabilizing after a 15% rebound from $3,435, aligning with daily bull flag formations that support upward bias if momentum builds.
Risks and Outlook
While the setup appears constructive, it remains at risk below critical resistances; a failure to hold $3,700 could expose lower supports. On-chain data offers optimism, with MVRV ratios at historical support levels hinting at rallies, but external factors like market sentiment could influence outcomes.
Price Action and Historical Context
Recent price action on the 4H chart reveals a series of lower highs and lows following a rejection from the $4,200 breakdown zone earlier in October. Over the last 10-20 candles, ETH has oscillated within a tight range, with bullish candles attempting rebounds from supports around $3,860 but facing consistent selling pressure near $3,930–$3,950. This follows a sharper decline from mid-October peaks near $4,500, where volume spiked during pullbacks, indicating profit-taking or liquidation events. Volume trends show a 24-hour trading volume of approximately $23.36 billion, with a volume-to-market-cap ratio of 0.1019, suggesting moderate liquidity but no explosive buying yet.
Historically, ETH has shown resilience at these levels; for instance, the all-time high reached $4,955 on August 23, 2025, before correcting. Year-to-date, ETH is up 46.95%, but the recent 15% rebound from a two-month low of $3,435 highlights a V-shaped recovery pattern, supported by institutional demand zones. Contrasting views from analysts note that while short-term weakness persists (e.g., from $4,450–$4,500 resistance), the structure remains intact for potential upside if global sentiment
Chart Patterns and Structures
The dominant pattern on the 4H timeframe is a descending wedge, formed after the rejection from $4,200, with converging trendlines indicating compression between buyers and sellers. The lower boundary aligns with the $3,400–$3,500 institutional demand zone, while the upper trendline coincides with resistance at $4,000–$4,100. This setup is often bullish, as wedges typically resolve upward, but confirmation requires a close above the descending trendline.
Penafian
Maklumat dan penerbitan adalah tidak bertujuan, dan tidak membentuk, nasihat atau cadangan kewangan, pelaburan, dagangan atau jenis lain yang diberikan atau disahkan oleh TradingView. Baca lebih dalam Terma Penggunaan.
Penafian
Maklumat dan penerbitan adalah tidak bertujuan, dan tidak membentuk, nasihat atau cadangan kewangan, pelaburan, dagangan atau jenis lain yang diberikan atau disahkan oleh TradingView. Baca lebih dalam Terma Penggunaan.