---- Short-term Analysis for the next coming 1 to 3 Weeks - Based on 3h Chart -------
ETH/USDT: Selling area reached - direct drop expected
Context
The Global Crypto market leads by BTC and ETH is still evolving within a bearish market configuration. the actual bounce offers a sell opportunity
N.B => The ETH is actually underperforming BTC, it means that the drop expected on ETH will be stronger than BTC
Market configuration
- Graphical Elements :
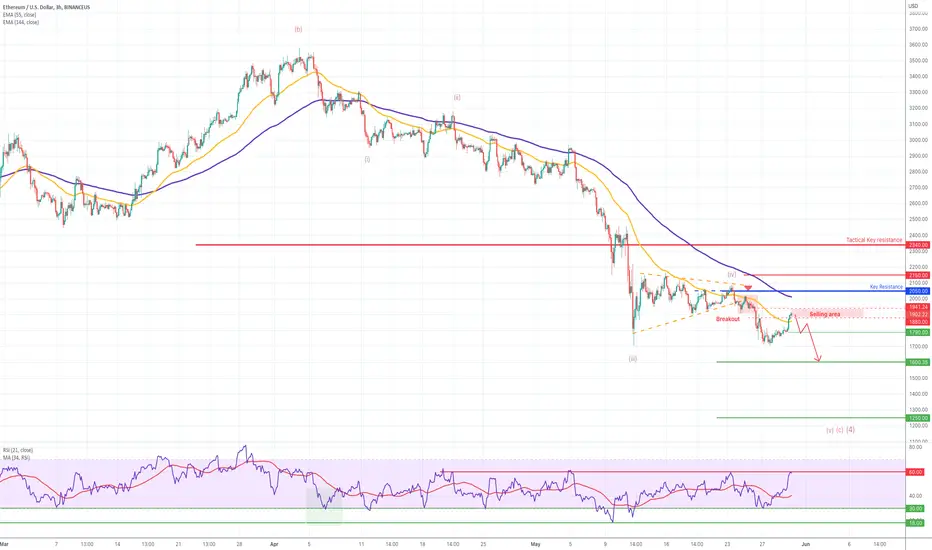
Graphical Resistance = 2050 & 2340
- Mathematical Indicators:
EMA ( Exp Moving averages) are still in bearish configuration
RSI indicator (below) is close to resistance = end of bounce
- Elliot & Harmonic Wave (Fibonacci):
A last drop to draw the wave (v) (c) (4) is missing - the market is actually drawing the wave (v)
Fibonacci resistance in the current wave (v) = 2050
Fibonacci support of the wave 5 C (4) = 1600 and in extension 1250
Fibonacci short-term wave = 1790
Conclusion
Prefered case => The ETH is expecting to be sold in the coming days as long as 2050 remains a resistance valid - the selling area has been reached and a new drop towards 1790/1600 Is expected
Alternative case => The ETH bounce above 2050. a larger rise towards 2150 and 2340 the Tactical resistance will be validated. Note the 2340 is the actual equivalent of 34000, in this scenario a recovery on ETH/BTC rate = ETH outperformance will conduct to align ETH and BTC performance.
ETH/USDT: Selling area reached - direct drop expected
Context
The Global Crypto market leads by BTC and ETH is still evolving within a bearish market configuration. the actual bounce offers a sell opportunity
N.B => The ETH is actually underperforming BTC, it means that the drop expected on ETH will be stronger than BTC
Market configuration
- Graphical Elements :
Graphical Resistance = 2050 & 2340
- Mathematical Indicators:
EMA ( Exp Moving averages) are still in bearish configuration
RSI indicator (below) is close to resistance = end of bounce
- Elliot & Harmonic Wave (Fibonacci):
A last drop to draw the wave (v) (c) (4) is missing - the market is actually drawing the wave (v)
Fibonacci resistance in the current wave (v) = 2050
Fibonacci support of the wave 5 C (4) = 1600 and in extension 1250
Fibonacci short-term wave = 1790
Conclusion
Prefered case => The ETH is expecting to be sold in the coming days as long as 2050 remains a resistance valid - the selling area has been reached and a new drop towards 1790/1600 Is expected
Alternative case => The ETH bounce above 2050. a larger rise towards 2150 and 2340 the Tactical resistance will be validated. Note the 2340 is the actual equivalent of 34000, in this scenario a recovery on ETH/BTC rate = ETH outperformance will conduct to align ETH and BTC performance.
Dagangan ditutup: sasaran tercapai
Target reachedBullish reversal expected between 12500 and 1600
CIO & Head of market research (Automata - Vancelian)
vancelian.com/en
vancelian.com/en
Penafian
Maklumat dan penerbitan adalah tidak dimaksudkan untuk menjadi, dan tidak membentuk, nasihat untuk kewangan, pelaburan, perdagangan dan jenis-jenis lain atau cadangan yang dibekalkan atau disahkan oleh TradingView. Baca dengan lebih lanjut di Terma Penggunaan.