Just an idea from a newbie so
**do not take this as advice or anything, just ignore and carry on**.
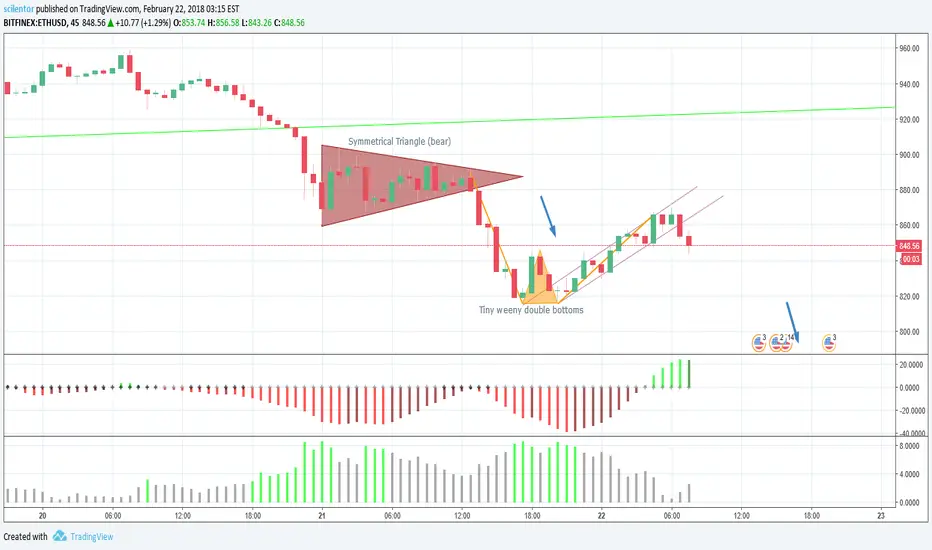
I'm thinking we're moving towards the 800's and if broken we might go to the buy zone of 750-780 if adjusted to historical data from 2016. If a diamond bottoms or inverted head and shoulders is formed here I would call this a buy signal for long bull.
Just started learning, so any feedback appreciated in case someone happens to take a look at this.
**do not take this as advice or anything, just ignore and carry on**.
I'm thinking we're moving towards the 800's and if broken we might go to the buy zone of 750-780 if adjusted to historical data from 2016. If a diamond bottoms or inverted head and shoulders is formed here I would call this a buy signal for long bull.
Just started learning, so any feedback appreciated in case someone happens to take a look at this.
Nota
Seems like a bearish head and shoulders might be forming.Nota
Bearish h&s was formed and we've been slightly under 800. Will be a fall to the next resistance zone from here. Still waiting for positive signals.Nota
After confirming double bottom around 790 bulls are stampeding. Next big resistance around 900. We have broken a couple of bearish trends, the one going through 870 being one of them recently. Feeling bullish. This also being last update on this chart.Penafian
Maklumat dan penerbitan adalah tidak dimaksudkan untuk menjadi, dan tidak membentuk, nasihat untuk kewangan, pelaburan, perdagangan dan jenis-jenis lain atau cadangan yang dibekalkan atau disahkan oleh TradingView. Baca dengan lebih lanjut di Terma Penggunaan.
Penafian
Maklumat dan penerbitan adalah tidak dimaksudkan untuk menjadi, dan tidak membentuk, nasihat untuk kewangan, pelaburan, perdagangan dan jenis-jenis lain atau cadangan yang dibekalkan atau disahkan oleh TradingView. Baca dengan lebih lanjut di Terma Penggunaan.