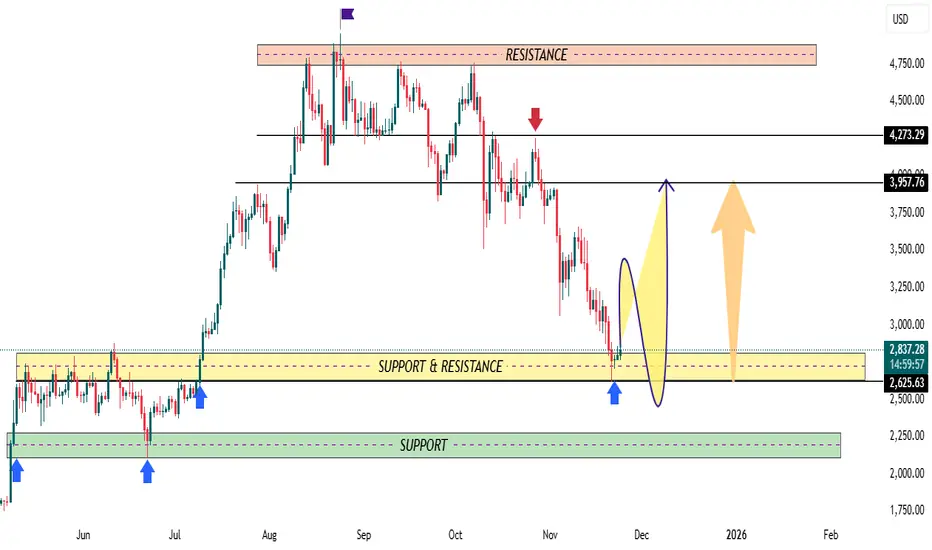
🔍 ETH/USD Market Structure Overview
1️⃣ Major Resistance Zone (Red Box — ~$4,150–$4,700)
This is a strong multi-touch rejection area.
Price previously failed to break above this zone several times (purple arrow), confirming heavy supply.
If market eventually rallies back into this zone, expect profit-taking and bearish reactions.
🟨 2️⃣ Mid-Range Support & Resistance ($2,625–$2,900)
(Yellow highlighted zone)
This level is acting as a key pivot, previously serving as both:
Support during the June–July accumulation.
Resistance in the early phase of the uptrend.
Recently turned support again, with the new bounce (blue arrow).
This zone is critical — price direction from here will define the next macro trend.
🟩 3️⃣ Major Support Zone ($2,200–$2,450)
(Green zone)
Historically, this range triggered strong bullish reactions (multiple blue arrows).
If the current mid-range support fails, price may retest this deeper demand zone, creating a long-term buying opportunity.
📉 4️⃣ Current Market Condition
ETH is currently in a downtrend, forming lower highs and lower lows.
However, price has now entered the high-value demand zone ($2.6–$2.9k), where buyers are historically active.
The chart suggests:
🟦 Short-term: Bounce expected
Price may push up toward the $3,950 zone (black resistance line).
🔄 Mid-term: Possible retest scenario
The drawn yellow projection shows:
A bounce ✔️
Then a drop back into the same support ✔️
Before a stronger rally to key resistance ✔️
This is a classic accumulation shakeout pattern.
🚀 5️⃣ Bullish Scenario (Blue Arrow)
If bullish order flow enters:
ETH could rally toward $3,950 (structural resistance).
A break above that level may push price toward $4,270.
Key Bullish Trigger:
✔️ A daily close above $3,950.
⚠️ 6️⃣ Bearish Scenario (Orange Arrow)
If price fails to hold $2,625:
Expect a drop back into the major green support zone ($2.2–$2.45k).
This is where long-term buyers may step in again.
Key Bearish Trigger:
❌ Breakdown below $2,625 with strong volume.
🎯 Conclusion
ETH is sitting in a critical decision zone.
The next major move depends on whether the $2.6–$2.9k support holds.
📌 Upside targets: $3,950 → $4,270
📌 Downside targets: $2,450 → $2,250
JOIN MY TELEGRAM CHANNEL LINK 👇🏻
t.me/ALI_TREADRSPRO
JOIN MY REFFERALED BROKER LINK 👇🏻
one.exnessonelink.com/a/uvd1etcgg1
refferal code
uvd1etcgg1
t.me/ALI_TREADRSPRO
JOIN MY REFFERALED BROKER LINK 👇🏻
one.exnessonelink.com/a/uvd1etcgg1
refferal code
uvd1etcgg1
Penerbitan berkaitan
Penafian
The information and publications are not meant to be, and do not constitute, financial, investment, trading, or other types of advice or recommendations supplied or endorsed by TradingView. Read more in the Terms of Use.