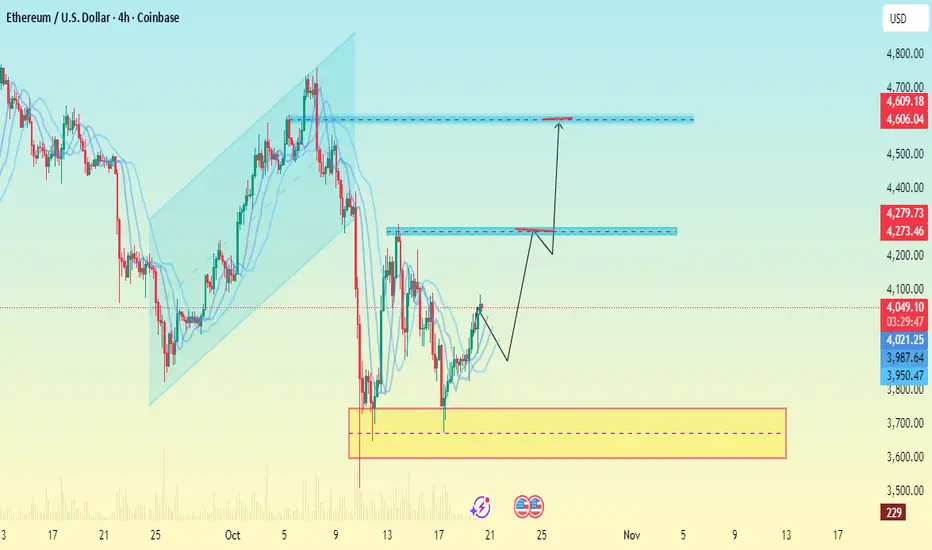
Current Price Zone: Around $3,997, with a small upward move visible.
Support Area (yellow zone): Roughly $3,600 – $3,750, showing the last strong demand zone where price previously reversed.
First Resistance Zone (blue box): Around $4,270 – $4,280, where price may face initial selling pressure.
Second Target Zone (upper blue box): Near $4,600 – $4,660, which appears to be your main bullish target.
Projected Path: The drawn arrows suggest a bullish structure, expecting a short pullback from current levels before continuation upward — a potential break of structure and retest setup.
Technical View:
The chart implies a potential bullish reversal off the yellow support zone.
If ETH holds above $3,900–$3,950, the next logical upside targets are $4,270 and $4,660.
A drop below $3,750 would invalidate this bullish scenario and reopen the door to further downside.
Penafian
The information and publications are not meant to be, and do not constitute, financial, investment, trading, or other types of advice or recommendations supplied or endorsed by TradingView. Read more in the Terms of Use.
Penafian
The information and publications are not meant to be, and do not constitute, financial, investment, trading, or other types of advice or recommendations supplied or endorsed by TradingView. Read more in the Terms of Use.