ETHUSD 4H Chart Pattern
📌 Target Zone
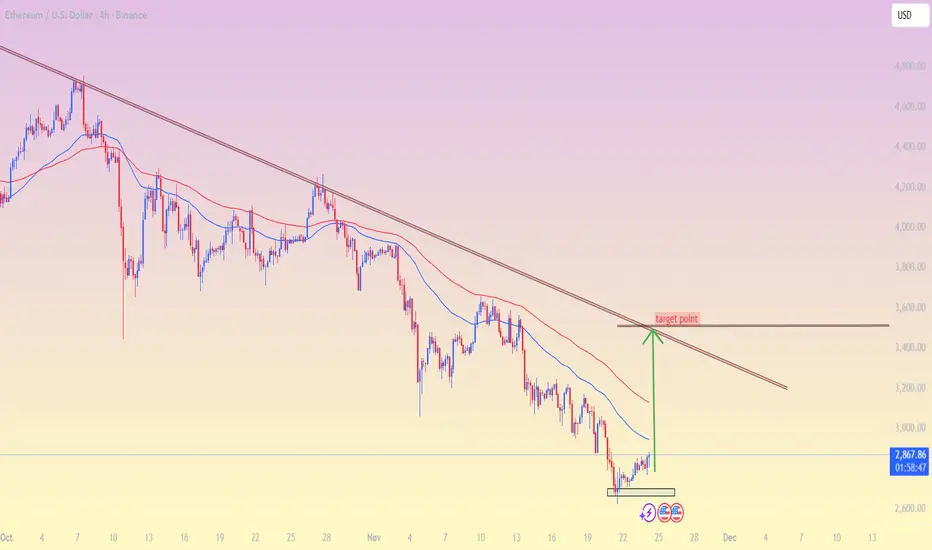
My chart shows price around $2,860 and the trendline resistance sitting roughly around:
➡ Target: $3,450 – $3,550
This zone comes from:
The descending trendline (major resistance)
The level my marked with the green arrow
Previous reaction zone where price last rejected
🔍 Why this target
Price is forming a short-term bottom.
A bounce toward the trendline resistance is reasonable if momentum continues.
That trendline is the next major obstacle for bulls.
⚠ Important
These are technical analysis levels, not financial advice. Always evaluate risk and market conditions.
If my want, I can also give: ✔ Support levels
✔ Breakout target
✔ Stop-loss ideas (educational)
✔ Updated analysis with timeframe my prefer
📌 Target Zone
My chart shows price around $2,860 and the trendline resistance sitting roughly around:
➡ Target: $3,450 – $3,550
This zone comes from:
The descending trendline (major resistance)
The level my marked with the green arrow
Previous reaction zone where price last rejected
🔍 Why this target
Price is forming a short-term bottom.
A bounce toward the trendline resistance is reasonable if momentum continues.
That trendline is the next major obstacle for bulls.
⚠ Important
These are technical analysis levels, not financial advice. Always evaluate risk and market conditions.
If my want, I can also give: ✔ Support levels
✔ Breakout target
✔ Stop-loss ideas (educational)
✔ Updated analysis with timeframe my prefer
Dagangan aktif
active active 📲 Join telegram channel free ..
t.me/RSI_Trading_Point4
Forex, Gold & Crypto Signals with detailed analysis & get consistent results..
t.me/XauusdGlobalSignal17
Gold Signal's with proper TP & SL for high profit opportunities..
t.me/RSI_Trading_Point4
Forex, Gold & Crypto Signals with detailed analysis & get consistent results..
t.me/XauusdGlobalSignal17
Gold Signal's with proper TP & SL for high profit opportunities..
Penerbitan berkaitan
Penafian
The information and publications are not meant to be, and do not constitute, financial, investment, trading, or other types of advice or recommendations supplied or endorsed by TradingView. Read more in the Terms of Use.
📲 Join telegram channel free ..
t.me/RSI_Trading_Point4
Forex, Gold & Crypto Signals with detailed analysis & get consistent results..
t.me/XauusdGlobalSignal17
Gold Signal's with proper TP & SL for high profit opportunities..
t.me/RSI_Trading_Point4
Forex, Gold & Crypto Signals with detailed analysis & get consistent results..
t.me/XauusdGlobalSignal17
Gold Signal's with proper TP & SL for high profit opportunities..
Penerbitan berkaitan
Penafian
The information and publications are not meant to be, and do not constitute, financial, investment, trading, or other types of advice or recommendations supplied or endorsed by TradingView. Read more in the Terms of Use.