Welcome everyone,
In this chart, you can see two labels:
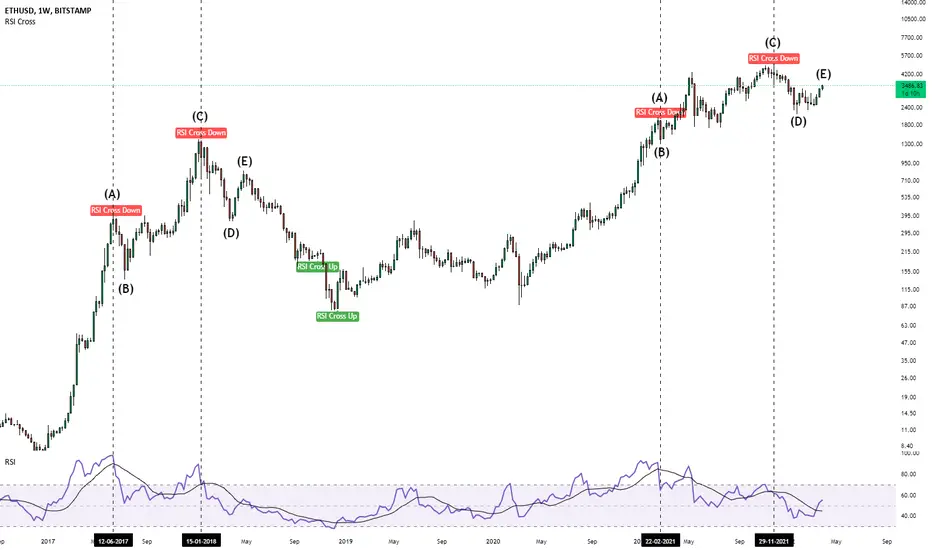
1. RSI Cross Down
2. RSI Cross UP
When RSI crosses RSI's SMA and RSI < 40, it's Cross UP.
And When RSI crosses RSI's SMA and RSI > 60, it's Cross Down.
In the chart, you can see how the similar pattern has been formed on Ethereum Weekly.
If this is the case again, you can see a drop down from (E) pretty soon.
Let me know what you think about this idea.
Thanks for visiting ;)
In this chart, you can see two labels:
1. RSI Cross Down
2. RSI Cross UP
When RSI crosses RSI's SMA and RSI < 40, it's Cross UP.
And When RSI crosses RSI's SMA and RSI > 60, it's Cross Down.
In the chart, you can see how the similar pattern has been formed on Ethereum Weekly.
If this is the case again, you can see a drop down from (E) pretty soon.
Let me know what you think about this idea.
Thanks for visiting ;)
Penerbitan berkaitan
Penafian
Maklumat dan penerbitan adalah tidak dimaksudkan untuk menjadi, dan tidak membentuk, nasihat untuk kewangan, pelaburan, perdagangan dan jenis-jenis lain atau cadangan yang dibekalkan atau disahkan oleh TradingView. Baca dengan lebih lanjut di Terma Penggunaan.
Penerbitan berkaitan
Penafian
Maklumat dan penerbitan adalah tidak dimaksudkan untuk menjadi, dan tidak membentuk, nasihat untuk kewangan, pelaburan, perdagangan dan jenis-jenis lain atau cadangan yang dibekalkan atau disahkan oleh TradingView. Baca dengan lebih lanjut di Terma Penggunaan.