I thought this may help.
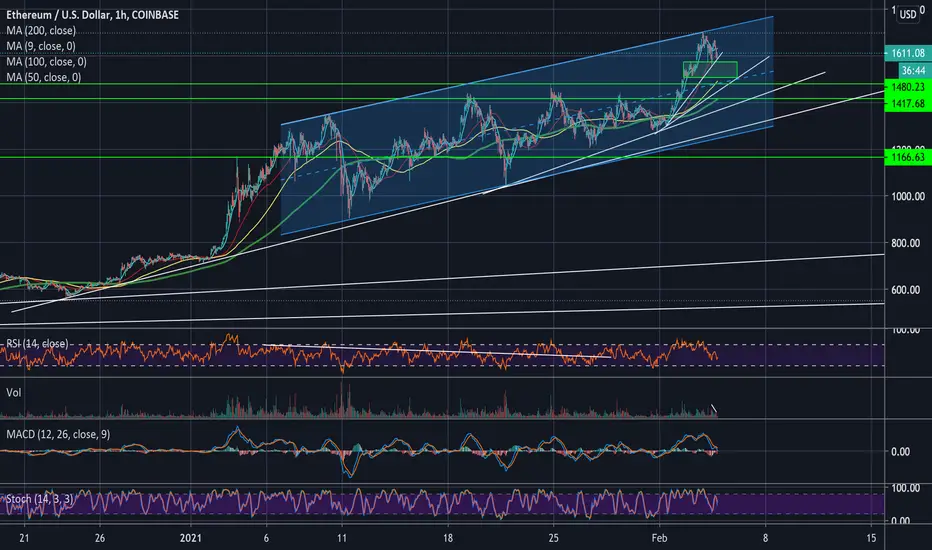
Parallel Ethereum up channel shown, while price remains above the "control line" dotted blue centre line, bulls are in charge, as per classical technical analysis. If price moves below control line, bears have more control. Bulls firmly in control here. Trade positioning is dip buying and holding.
Green lines and zones are support. Stop losses can be placed accordingly depending on the timeframe your trading in.
Please also see post here and yesterday on my page showing biases towards current parabolic move (weekly timeframe) on ETH to $3000.
Dagangan aktif
Add to eth longsPenafian
Maklumat dan penerbitan adalah tidak dimaksudkan untuk menjadi, dan tidak membentuk, nasihat untuk kewangan, pelaburan, perdagangan dan jenis-jenis lain atau cadangan yang dibekalkan atau disahkan oleh TradingView. Baca dengan lebih lanjut di Terma Penggunaan.
Penafian
Maklumat dan penerbitan adalah tidak dimaksudkan untuk menjadi, dan tidak membentuk, nasihat untuk kewangan, pelaburan, perdagangan dan jenis-jenis lain atau cadangan yang dibekalkan atau disahkan oleh TradingView. Baca dengan lebih lanjut di Terma Penggunaan.