Hello Traders 👋
Looking at the ETHUSD (Ethereum vs USD) chart, price action recently gave us some important signals worth noting.
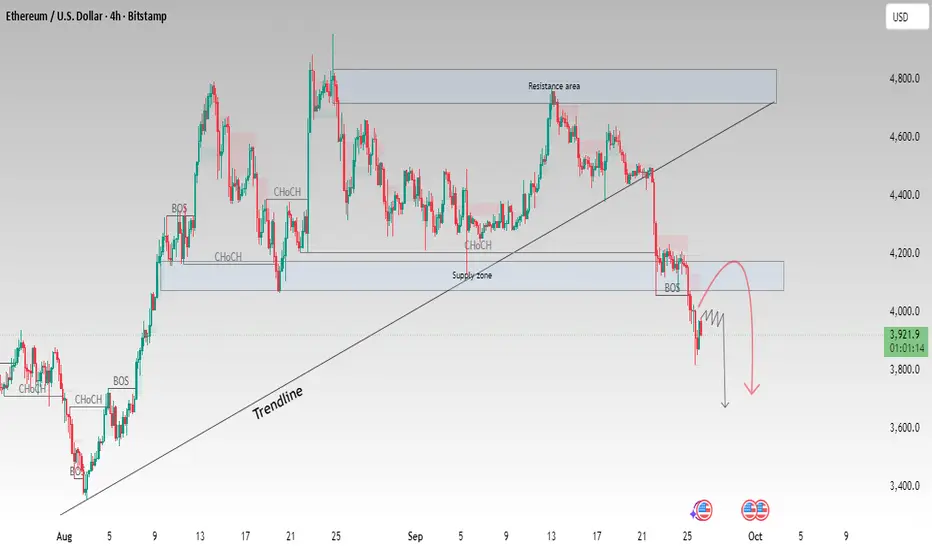
🔹 Trendline Break – The ascending trendline that supported ETH for several weeks has been broken, indicating weakness in bullish momentum.
🔹 Break of Structure (BOS) – Multiple BOS levels on the chart confirm sellers are currently in control. This means the market is no longer making higher highs and higher lows, but instead shifting toward lower highs and lower lows.
🔹 Support & Resistance Zones – After the breakdown, ETH retested the previous support area (now acting as resistance). Sellers stepped in strongly, and the rejection suggests continuation to the downside.
🔹 Possible Bearish Scenario – If the price fails to reclaim the broken structure, we may see a continuation of the bearish move, with targets around the next support zone.
🔹 Bullish Invalidations – For the bullish side to regain control, price must break back above the resistance zone and maintain higher closes. Until then, market structure favors sellers.
This analysis is for educational purposes only and not financial advice.
Looking at the ETHUSD (Ethereum vs USD) chart, price action recently gave us some important signals worth noting.
🔹 Trendline Break – The ascending trendline that supported ETH for several weeks has been broken, indicating weakness in bullish momentum.
🔹 Break of Structure (BOS) – Multiple BOS levels on the chart confirm sellers are currently in control. This means the market is no longer making higher highs and higher lows, but instead shifting toward lower highs and lower lows.
🔹 Support & Resistance Zones – After the breakdown, ETH retested the previous support area (now acting as resistance). Sellers stepped in strongly, and the rejection suggests continuation to the downside.
🔹 Possible Bearish Scenario – If the price fails to reclaim the broken structure, we may see a continuation of the bearish move, with targets around the next support zone.
🔹 Bullish Invalidations – For the bullish side to regain control, price must break back above the resistance zone and maintain higher closes. Until then, market structure favors sellers.
This analysis is for educational purposes only and not financial advice.
Dagangan aktif
Dagangan ditutup: hentian tercapai
$ FOREX / GOLD / BTC | Real Trades,Real Result | Risk-managed strategiesn &VIP Signal {My Personal Entries} Join Telegram _ Trade smater ||
📬 Join Free Channel:
t.me/profitmagnetpro12
📬 Join Free Channel:
t.me/profitmagnetpro12
Penafian
Maklumat dan penerbitan adalah tidak dimaksudkan untuk menjadi, dan tidak membentuk, nasihat untuk kewangan, pelaburan, perdagangan dan jenis-jenis lain atau cadangan yang dibekalkan atau disahkan oleh TradingView. Baca dengan lebih lanjut di Terma Penggunaan.