ETH/USDT – Symmetrical Diametric in Progress (4H Analysis)
Here’s a TradingView post designed for your ETH/USDT 4H chart analysis using NeoWave – Symmetrical Diametric structure:
---
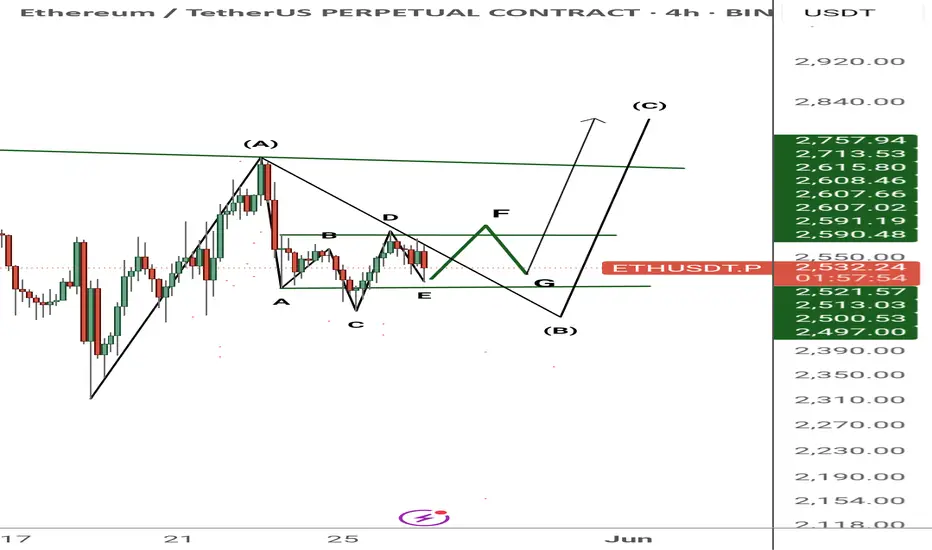
A rare and clean Symmetrical Diametric seems to be unfolding on the 4H ETH/USDT chart, following Glenn Neely’s advanced NeoWave principles.
Current Structure:
Waves A, B, C, D, and E have completed
All legs are nearly equal in time with clear directional alternation
Wave E retraced exactly 61.8% of Wave D, confirming symmetry
What's Next?
Wave F is likely starting now — expect an upward move
If correct, Higher High (HH) will be formed above Wave E
After that, Wave G will complete the 7-legged diametric with a Higher Low (HL) structure
Key Observations:
Time symmetry = strong confirmation for a Symmetrical Diametric
Current range: $2,500–2,610
Break above $2,590 will reinforce bullish Wave F development
Trading Outlook:
Watch for bullish confirmation near $2,540–2,550 zone
Wave F may target the $2,590–2,610 resistance zone
Final Wave G could offer a buy-the-dip opportunity if it respects symmetry
Pattern: Symmetrical Diametric
Current Wave: Likely beginning of Wave F
Bias: Short-term bullish, mid-term neutral (until Wave G ends)
DYOR – This is not financial advice.
Share your thoughts below — Do you also see the Diametric?

 ETHUSDT
  BTCUSDT ETHUSDT.P ETHBTC ETHUSDT.P
---
A rare and clean Symmetrical Diametric seems to be unfolding on the 4H ETH/USDT chart, following Glenn Neely’s advanced NeoWave principles.
Current Structure:
Waves A, B, C, D, and E have completed
All legs are nearly equal in time with clear directional alternation
Wave E retraced exactly 61.8% of Wave D, confirming symmetry
What's Next?
Wave F is likely starting now — expect an upward move
If correct, Higher High (HH) will be formed above Wave E
After that, Wave G will complete the 7-legged diametric with a Higher Low (HL) structure
Key Observations:
Time symmetry = strong confirmation for a Symmetrical Diametric
Current range: $2,500–2,610
Break above $2,590 will reinforce bullish Wave F development
Trading Outlook:
Watch for bullish confirmation near $2,540–2,550 zone
Wave F may target the $2,590–2,610 resistance zone
Final Wave G could offer a buy-the-dip opportunity if it respects symmetry
Pattern: Symmetrical Diametric
Current Wave: Likely beginning of Wave F
Bias: Short-term bullish, mid-term neutral (until Wave G ends)
DYOR – This is not financial advice.
Share your thoughts below — Do you also see the Diametric?
Penafian
Maklumat dan penerbitan adalah tidak dimaksudkan untuk menjadi, dan tidak membentuk, nasihat untuk kewangan, pelaburan, perdagangan dan jenis-jenis lain atau cadangan yang dibekalkan atau disahkan oleh TradingView. Baca dengan lebih lanjut di Terma Penggunaan.
Penafian
Maklumat dan penerbitan adalah tidak dimaksudkan untuk menjadi, dan tidak membentuk, nasihat untuk kewangan, pelaburan, perdagangan dan jenis-jenis lain atau cadangan yang dibekalkan atau disahkan oleh TradingView. Baca dengan lebih lanjut di Terma Penggunaan.