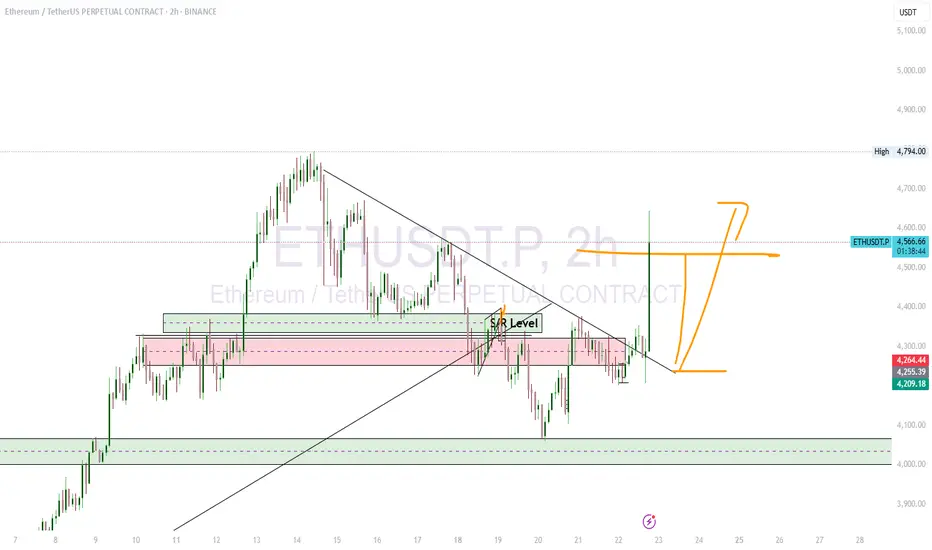
Bullish Momentum: The price has moved significantly higher from the S/R level and is currently trading at the higher end of the recent range.
Impulsive Move: The recent candle is a large green candle, indicating strong buying pressure and an impulsive move to the upside.
Potential Pullback: As mentioned in the previous analysis, the price may experience a pullback or a retest of the broken trendline. The strong move up could be followed by some profit-taking before a continuation of the trend. This is a common pattern in breakouts.
Key Levels: The price action confirms that the S/R level around $4,284 is a critical area. As long as the price stays above this level, the bullish structure remains intact. A break below this level could signal a false breakout and a return to the previous range.
Penafian
Maklumat dan penerbitan adalah tidak dimaksudkan untuk menjadi, dan tidak membentuk, nasihat untuk kewangan, pelaburan, perdagangan dan jenis-jenis lain atau cadangan yang dibekalkan atau disahkan oleh TradingView. Baca dengan lebih lanjut di Terma Penggunaan.
Penafian
Maklumat dan penerbitan adalah tidak dimaksudkan untuk menjadi, dan tidak membentuk, nasihat untuk kewangan, pelaburan, perdagangan dan jenis-jenis lain atau cadangan yang dibekalkan atau disahkan oleh TradingView. Baca dengan lebih lanjut di Terma Penggunaan.