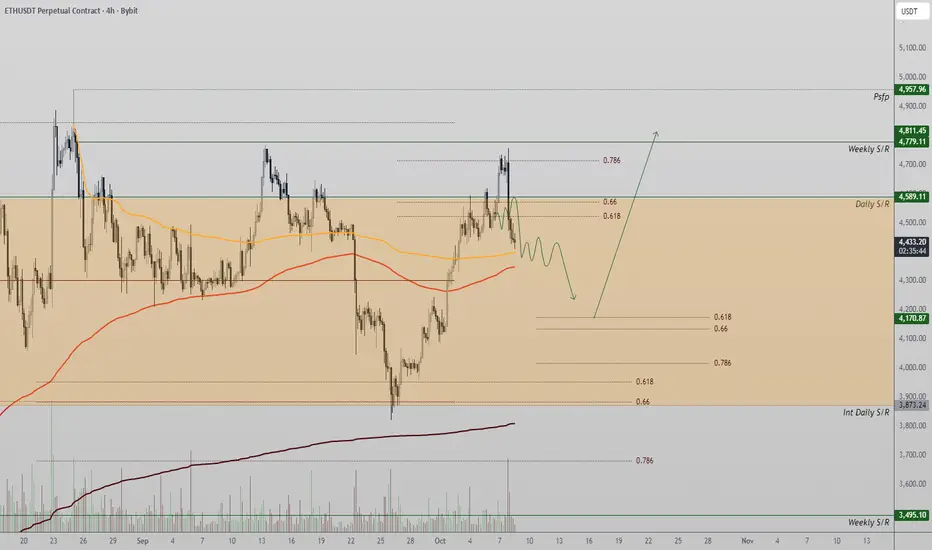
Ethereum re-entered its prior trading range after a failed breakout above $4,589. Despite the retracement, market structure remains bullish, with a potential higher-low formation developing near the 0.618 Fibonacci zone.
Ethereum’s recent failure to sustain momentum above the $4,589 resistance led to a quick re-acceptance back into its prior range. This type of “failed auction” pattern often triggers short-term corrections, allowing the market to rebalance and find fresh demand at lower levels. However, despite the rejection, the broader uptrend remains intact, supported by higher highs and higher lows on both the daily and weekly timeframes.
The area between $4,250 and $4,300 represents a critical support zone — aligning with the 0.618 Fibonacci retracement level. Historically, ETH has treated this level as a springboard for continuation moves during trending conditions. A controlled pullback into this region would likely attract dip buyers, reinforcing the macro bullish narrative. Furthermore, on-chain metrics show steady network activity and staking participation, which supports long-term accumulation.
Should ETH reclaim the $4,589 zone, bullish continuation toward $4,950–$5,000 becomes likely. Conversely, if the 0.618 level fails to hold, a deeper retracement into $4,050 could occur before recovery.
What to Expect:
Ethereum remains bullish overall, with the current dip seen as corrective. A confirmed higher low at the Fibonacci zone would reaffirm momentum toward $5,000 resistance in the sessions ahead.
Join the Free Trading Group
Telegram: t.me/freetradingden 🔥
Claim $1000 Deposit Bonus 🎁
Trade with perks & support the community!
partner.blofin.com/d/TheAlchemist
Stay sharp, trade smart.
— Team The Alchemist ⚔️
Telegram: t.me/freetradingden 🔥
Claim $1000 Deposit Bonus 🎁
Trade with perks & support the community!
partner.blofin.com/d/TheAlchemist
Stay sharp, trade smart.
— Team The Alchemist ⚔️
Penafian
Maklumat dan penerbitan adalah tidak dimaksudkan untuk menjadi, dan tidak membentuk, nasihat untuk kewangan, pelaburan, perdagangan dan jenis-jenis lain atau cadangan yang dibekalkan atau disahkan oleh TradingView. Baca dengan lebih lanjut di Terma Penggunaan.