Hello traders 🐺 .
before I start , I want to mention an important point about the ETH moves in the market ; usually most of the time you can use ETH moves as indication for the BTC moves , for example when market start to drop , ETH price drop begin sooner than the BTC and it's usually have more aggressive move compare to the BTC . but why I say this ?
in the most of the time when you want to find a bottom for the BTC price , definitely you start your TA by looking at the BTC chart , but what can help you more to be better in your TA and in your trading , is looking at the ETH situation too ; because ETH moves is very important in the market ; first of all most of the ALTCOINS start to rise beside the ETH and drop when ETH start to drop , and second important points about the ETH is that , ETH is a indication for the BTC moves too .
ok now it's time to look at the ETH price :

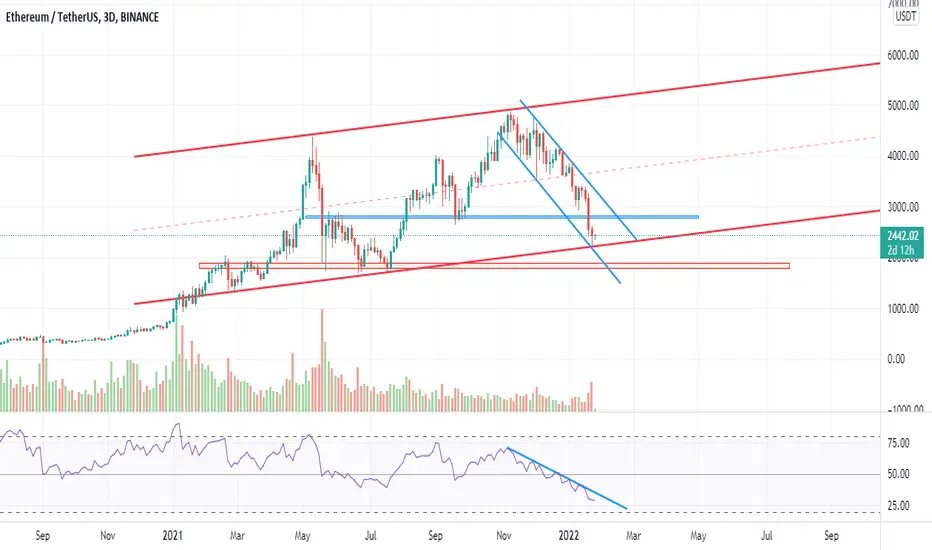
in the chart above you can see ETH is on the very big ascending channel and now it's trying to retest the lower trend line of the channel so you can say that ETH is above the ascending trend line so in the higher time frame like weekly and monthly ETH is still bullish , and in the other side ETH currently is very close to the weekly support structure ( red box ) so up to know thing is not looking too bad for ETH ;
but when you goes to the daily time frame and lower than that , you can definitely see LL and LH and its means that we are in the bear trend in the daily time frame .
also inside of this giant ascending channel we have a daily descending channel also in the RSI you can see a very clear downward trend line , in my opinion when RSI value break the trend line and ETH price break the descending channel with the big green candle and retest it as a new support , we can say things are looking good for the ETH and maybe this was a bottom for the ETH .
let's look at the 4H time frame :

in the 4H time frame we have a clear bullish divergence and it's a very good sign to see this bullish divergence because this is first sign of the trend reversal or at least going sideways in the lower time frame .
before I start , I want to mention an important point about the ETH moves in the market ; usually most of the time you can use ETH moves as indication for the BTC moves , for example when market start to drop , ETH price drop begin sooner than the BTC and it's usually have more aggressive move compare to the BTC . but why I say this ?
in the most of the time when you want to find a bottom for the BTC price , definitely you start your TA by looking at the BTC chart , but what can help you more to be better in your TA and in your trading , is looking at the ETH situation too ; because ETH moves is very important in the market ; first of all most of the ALTCOINS start to rise beside the ETH and drop when ETH start to drop , and second important points about the ETH is that , ETH is a indication for the BTC moves too .
ok now it's time to look at the ETH price :
in the chart above you can see ETH is on the very big ascending channel and now it's trying to retest the lower trend line of the channel so you can say that ETH is above the ascending trend line so in the higher time frame like weekly and monthly ETH is still bullish , and in the other side ETH currently is very close to the weekly support structure ( red box ) so up to know thing is not looking too bad for ETH ;
but when you goes to the daily time frame and lower than that , you can definitely see LL and LH and its means that we are in the bear trend in the daily time frame .
also inside of this giant ascending channel we have a daily descending channel also in the RSI you can see a very clear downward trend line , in my opinion when RSI value break the trend line and ETH price break the descending channel with the big green candle and retest it as a new support , we can say things are looking good for the ETH and maybe this was a bottom for the ETH .
let's look at the 4H time frame :
in the 4H time frame we have a clear bullish divergence and it's a very good sign to see this bullish divergence because this is first sign of the trend reversal or at least going sideways in the lower time frame .
_____________________________________
🐺 Discipline is rarely enjoyable ,
But almost always profitable 🐺
TElEGRAM CHANNEL : t.me/KIU_COIN
_____________________________________
🐺 Discipline is rarely enjoyable ,
But almost always profitable 🐺
TElEGRAM CHANNEL : t.me/KIU_COIN
_____________________________________
Penafian
Maklumat dan penerbitan adalah tidak dimaksudkan untuk menjadi, dan tidak membentuk, nasihat untuk kewangan, pelaburan, perdagangan dan jenis-jenis lain atau cadangan yang dibekalkan atau disahkan oleh TradingView. Baca dengan lebih lanjut di Terma Penggunaan.
_____________________________________
🐺 Discipline is rarely enjoyable ,
But almost always profitable 🐺
TElEGRAM CHANNEL : t.me/KIU_COIN
_____________________________________
🐺 Discipline is rarely enjoyable ,
But almost always profitable 🐺
TElEGRAM CHANNEL : t.me/KIU_COIN
_____________________________________
Penafian
Maklumat dan penerbitan adalah tidak dimaksudkan untuk menjadi, dan tidak membentuk, nasihat untuk kewangan, pelaburan, perdagangan dan jenis-jenis lain atau cadangan yang dibekalkan atau disahkan oleh TradingView. Baca dengan lebih lanjut di Terma Penggunaan.