💀 Hey , how's it going ? Come over here — Satoshi got something for you !
⏰ We’re analyzing ETH on the 1-hour timeframe timeframe .
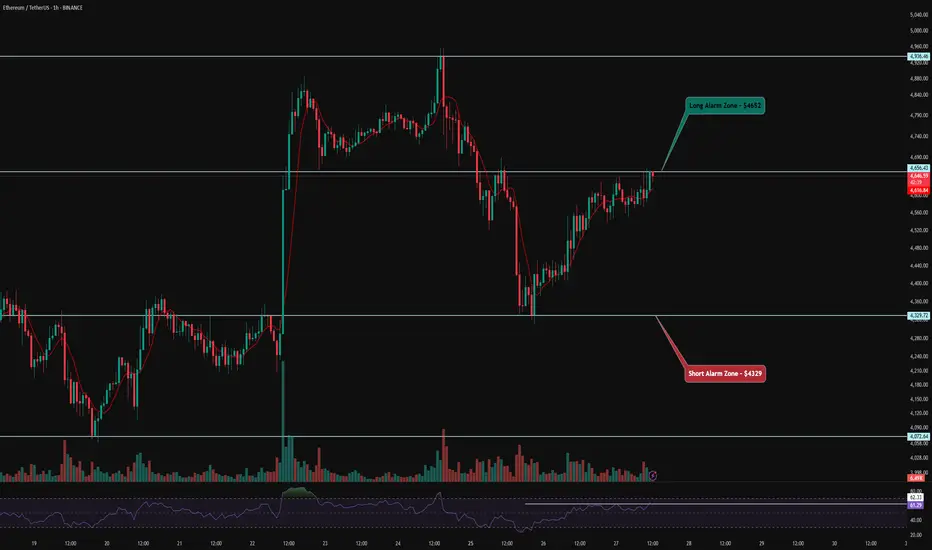
👀 On the 1H timeframe for Ethereum, we can observe that ETH is currently moving inside a V-pattern. If the price breaks out and consolidates above the neckline of this pattern, we could see a strong bullish continuation. Checking ETF flow data also shows heavy accumulation of Ethereum, which supports the bullish bias.
⚙️ The key RSI level for ETH sits around 62. Once the RSI crosses above this threshold, Ethereum has the potential to break the neckline of the V-pattern and push into the overbought zone, signaling further upside momentum.
🕯 Additionally, the volume, candle size, and number of green candles are increasing as ETH approaches this resistance. With rising trading volume, ETH could target higher price levels and potentially confirm a new all-time high.
🪙 On the 1H
 ETHBTC chart , we see a significant resistance level around 0.04274. A breakout above this zone with strong volume and volatility would provide an additional confirmation for a long position in Ethereum.

🔔 Our long setup alert zone is placed around $4652, while the short setup alert zone is positioned near $4329.
❤️ Disclaimer : This analysis is purely based on my personal opinion and I only trade if the stated triggers are activated .
⏰ We’re analyzing ETH on the 1-hour timeframe timeframe .
👀 On the 1H timeframe for Ethereum, we can observe that ETH is currently moving inside a V-pattern. If the price breaks out and consolidates above the neckline of this pattern, we could see a strong bullish continuation. Checking ETF flow data also shows heavy accumulation of Ethereum, which supports the bullish bias.
⚙️ The key RSI level for ETH sits around 62. Once the RSI crosses above this threshold, Ethereum has the potential to break the neckline of the V-pattern and push into the overbought zone, signaling further upside momentum.
🕯 Additionally, the volume, candle size, and number of green candles are increasing as ETH approaches this resistance. With rising trading volume, ETH could target higher price levels and potentially confirm a new all-time high.
🪙 On the 1H
🔔 Our long setup alert zone is placed around $4652, while the short setup alert zone is positioned near $4329.
❤️ Disclaimer : This analysis is purely based on my personal opinion and I only trade if the stated triggers are activated .
❄️ Join the Action Now ❄️
Telegram
t.me/CryptosWinter
Mexc
promote.mexc.com/r/HHAkF63P
Bitunix
bitunix.com/register?inviteCode=28r21f
Telegram
t.me/CryptosWinter
Mexc
promote.mexc.com/r/HHAkF63P
Bitunix
bitunix.com/register?inviteCode=28r21f
Penafian
Maklumat dan penerbitan adalah tidak dimaksudkan untuk menjadi, dan tidak membentuk, nasihat untuk kewangan, pelaburan, perdagangan dan jenis-jenis lain atau cadangan yang dibekalkan atau disahkan oleh TradingView. Baca dengan lebih lanjut di Terma Penggunaan.