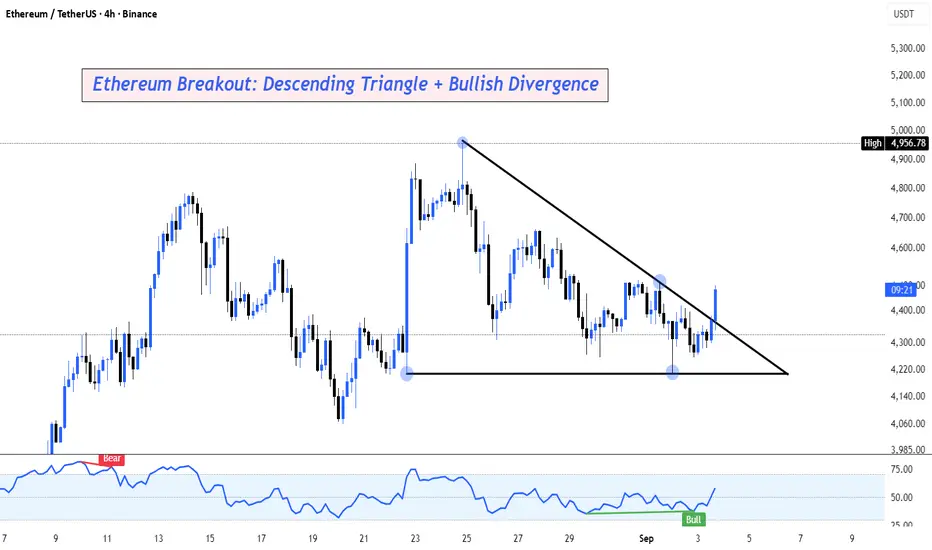
ETH has been consolidating inside a descending triangle, with lower highs pressing into horizontal support around $4,200–$4,250.
On this 4H timeframe, price has just broken above the trendline resistance with momentum confirmation from the RSI, showing a bullish divergence.
🔹 Bullish Case:
If ETH holds above the breakout zone, we could see continuation towards $4,480 → $4,600 liquidity pocket.
A sustained move above $4,600 opens the door toward $4,950–$5,000.
🔹 Bearish Invalidation:
If ETH fails to hold above $4,250, a retest of the $4,060 low remains on the table.
This breakout, paired with RSI strength, makes ETH one to watch closely this week.
👉 Do you think bulls can finally reclaim $4,600 and flip structure back to bullish?
Dagangan aktif
Penafian
Maklumat dan penerbitan adalah tidak dimaksudkan untuk menjadi, dan tidak membentuk, nasihat untuk kewangan, pelaburan, perdagangan dan jenis-jenis lain atau cadangan yang dibekalkan atau disahkan oleh TradingView. Baca dengan lebih lanjut di Terma Penggunaan.
Penafian
Maklumat dan penerbitan adalah tidak dimaksudkan untuk menjadi, dan tidak membentuk, nasihat untuk kewangan, pelaburan, perdagangan dan jenis-jenis lain atau cadangan yang dibekalkan atau disahkan oleh TradingView. Baca dengan lebih lanjut di Terma Penggunaan.