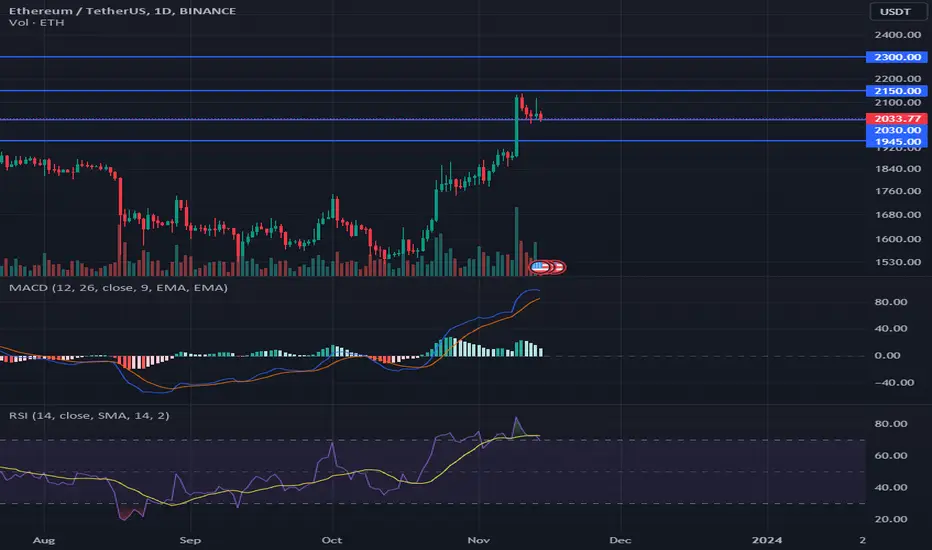
This bearish thesis could be invalidated if ETH closes the next 2 daily candles above $2,030. In this more bullish scenario, the altcoin may attempt a challenge at the $2,150 resistance level within the coming week. Thereafter, continued buy pressure could elevate the ethereum price to as high as $2,300 in the short term.
Investors will want to note that technical indicators suggested ETH’s price may drop in the next 24-48 hours. Firstly, the Moving Average Convergence Divergence (MACD) line was closing in on the MACD Signal line. This suggests that ETH’s bearish trend that it has been in over the last 3 days may continue in the next 2 days.
Adding credence to the bearish thesis is the daily Relative Strength Index (RSI) indicator. Throughout the previous 48 hours, the RSI line crossed below the RSI Simple Moving Average (SMA) line. This is generally taken as a sign of momentum shifting in favor of sellers.
Penafian
Maklumat dan penerbitan adalah tidak dimaksudkan untuk menjadi, dan tidak membentuk, nasihat untuk kewangan, pelaburan, perdagangan dan jenis-jenis lain atau cadangan yang dibekalkan atau disahkan oleh TradingView. Baca dengan lebih lanjut di Terma Penggunaan.
Penafian
Maklumat dan penerbitan adalah tidak dimaksudkan untuk menjadi, dan tidak membentuk, nasihat untuk kewangan, pelaburan, perdagangan dan jenis-jenis lain atau cadangan yang dibekalkan atau disahkan oleh TradingView. Baca dengan lebih lanjut di Terma Penggunaan.