ETH Daily – High Volume, Rising OI, and a Fight for Structure
ETH Daily – Volume King Leading the Rebound
At this moment, ETH shows the highest trading volume across major assets.
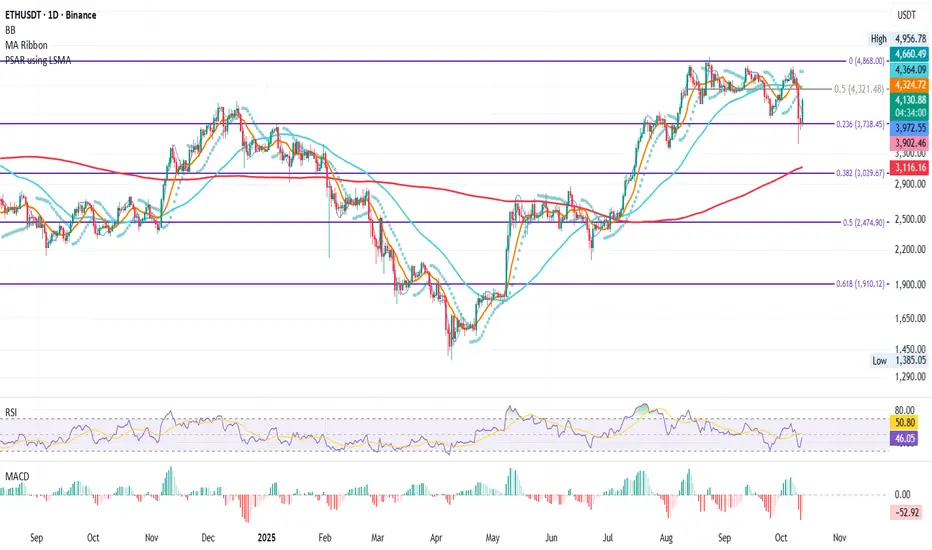
After the sharp crash that dragged price down to 3435$, under the 0.236 Fib level, ETH found strong support near 3738$,the 0.236Fib level.
From that level, price has now reclaimed the 4000$ mark, a psychological and technical milestone.
If momentum continues, the next resistance sits at the 0.5 Fib level around 4321$.
From a system perspective, structure remains technically bearish for now:
SMA < MLR < Price < BB Center, with PSAR still bearish (above price).
To flip structure bullish, ETH would need a daily close above the BB Center with PSAR reversal confirmation.
OI Analysis:
ETH OI +7.70% growth confirms new leveraged exposure entering during this rebound: a positive sign showing traders are adding risk rather than de-risking.
This increase in OI, combined with strong spot volume (74.6B in 24h), suggests conviction behind the recovery rather than a mere short-covering bounce.
However, elevated OI also means volatility risk is rising: if ETH fails to close above 4000$ or BB Center, liquidations could amplify the next pullback.
Bias:
Cautiously bullish, short-term momentum improving, structure still lagging. Watching daily close above 4k today and BBcenter for future confirmation.
High volume and rising OI often mark the start of a structural shift, but confirmation always comes from the daily close.
In moments like this, patience is what separates the trader reacting to price from the one anticipating the next move.
Always take profits and manage risk.
Interaction is welcome.
At this moment, ETH shows the highest trading volume across major assets.
After the sharp crash that dragged price down to 3435$, under the 0.236 Fib level, ETH found strong support near 3738$,the 0.236Fib level.
From that level, price has now reclaimed the 4000$ mark, a psychological and technical milestone.
If momentum continues, the next resistance sits at the 0.5 Fib level around 4321$.
From a system perspective, structure remains technically bearish for now:
SMA < MLR < Price < BB Center, with PSAR still bearish (above price).
To flip structure bullish, ETH would need a daily close above the BB Center with PSAR reversal confirmation.
OI Analysis:
ETH OI +7.70% growth confirms new leveraged exposure entering during this rebound: a positive sign showing traders are adding risk rather than de-risking.
This increase in OI, combined with strong spot volume (74.6B in 24h), suggests conviction behind the recovery rather than a mere short-covering bounce.
However, elevated OI also means volatility risk is rising: if ETH fails to close above 4000$ or BB Center, liquidations could amplify the next pullback.
Bias:
Cautiously bullish, short-term momentum improving, structure still lagging. Watching daily close above 4k today and BBcenter for future confirmation.
High volume and rising OI often mark the start of a structural shift, but confirmation always comes from the daily close.
In moments like this, patience is what separates the trader reacting to price from the one anticipating the next move.
Always take profits and manage risk.
Interaction is welcome.
Dagangan aktif
ETH Daily – Rejection at 0.5 Fib: Searching for SupportAfter the recent rebound, ETH faced a clean rejection from both the 0.5 Fib retracement (≈ 4321 $) and the BB Center, confirming resistance confluence.
Price is now retracing toward the 0.236 Fib level (≈ 3738 $), potentially forming a double bottom, though confirmation is still needed.
Price Action
Structure: MLR < Price < SMA < BB Center, PSAR above price
Market bias: short-term bearish.
If ETH holds 3738 $, a bounce toward 4000 $ is plausible, but a break below that level opens the door toward 200MA .
Futures & Derivatives Data (Coinalyze)
Open Interest: 19.2 B dollars (−0.79%), showing a slight contraction and cooling leverage.
Funding Rates: neutral to mildly negative (−0.003% to +0.01%), reflecting balanced sentiment across exchanges.
Liquidations (24 h): 71 M dollars total — 51 M longs versus 19 M shorts, showing pressure shifted to bulls after rejection.
Long/Short Ratio: around 2.8, with nearly 74% longs, indicating excessive optimism and the potential for another flush.
Interpretation
The data shows a mixed but heavy setup.
Funding and open interest cooling suggest reduced leverage and a healthy reset phase.
However, the persistent long dominance above 70% suggests that retail sentiment remains overly optimistic, which often precedes one final shakeout before reversal.
Bias
Short-term bearish, waiting for structural re-alignment.
Confirmation for a new long setup would require a daily close above the BB Center with MLR crossing above SMA.
For now, ETH remains in a correction phase rather than accumulation. Patience remains the advantage.
Penerbitan berkaitan
Penafian
Maklumat dan penerbitan adalah tidak dimaksudkan untuk menjadi, dan tidak membentuk, nasihat untuk kewangan, pelaburan, perdagangan dan jenis-jenis lain atau cadangan yang dibekalkan atau disahkan oleh TradingView. Baca dengan lebih lanjut di Terma Penggunaan.
Penerbitan berkaitan
Penafian
Maklumat dan penerbitan adalah tidak dimaksudkan untuk menjadi, dan tidak membentuk, nasihat untuk kewangan, pelaburan, perdagangan dan jenis-jenis lain atau cadangan yang dibekalkan atau disahkan oleh TradingView. Baca dengan lebih lanjut di Terma Penggunaan.