As I mentioned in my latest Bitcoin  and ChainLink analysis
  , I believe the crypto market is setting up for a huge long squeeze. Let’s break down why this move looks fragile and why you should be cautious.
What do we need for a healthy rally?
Right now? We don’t have these ingredients.
Step 1: Look at TOTAL3

For those unfamiliar,TOTAL3 is the crypto market cap excluding BTC and ETH. It’s a great index to measure the “altcoin market” and often shows where broader crypto is heading.
Now let’s apply some tools:
WhatTOTAL3 shows:
Example: Imagine two teams pushing on opposite sides of a door at the same time. Unless one side gets backup (spot demand), the door doesn’t move — it slams shut.
Step 2: Apply This to ETH
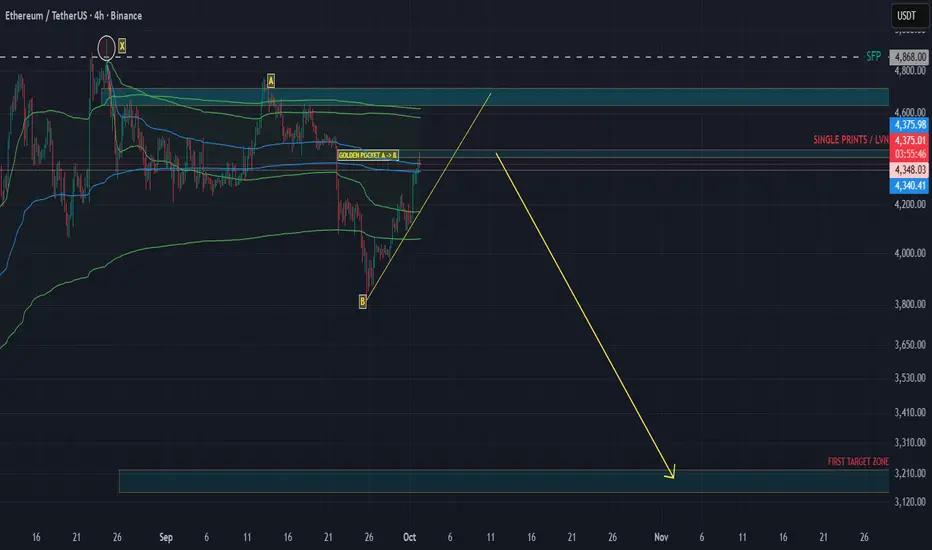
ETH
Now, let’s clear one thing up:TOTAL3 excludes both Bitcoin and Ethereum. It’s basically the “altcoin index,” showing how the rest of the market behaves without the two giants.
But here’s why it still matters for ETH:
So while ETH isn’t included inTOTAL3, the technical structure of TOTAL3 gives us strong hints about where ETH and the altcoin market could be heading.
Step 3: Check USDT Dominance (USDT.D)

Yes, you can chart USDT dominance, and it’s often a leading indicator. Why?
Right now:
Step 4: Order Flow – who’s really buying ETH?
This is where the story gets clear:
Stablecoin OI:
For those that don't understand it:The rally is built on FOMO leverage longs, not real buyers. That’s fragile.
Conclusion
All the ingredients are here for a mega squeeze:
When this unwinds, it won’t just be ETH. Expect broad crypto to follow.
The trap is unfolding. Don’t get caught on the wrong side.
What do we need for a healthy rally?
- Spot demand – Real buyers (spot market) need to step in and absorb supply. Without this, rallies are built on leverage and tend to collapse quickly.
- Controlled leverage – A healthy move isn’t fueled by overleveraged longs. If open interest keeps spiking while spot demand is flat or negative, that’s a recipe for a squeeze.
- Auction structure support – Price should build strong bases (value areas, balanced profiles) instead of just ripping up through inefficiencies.
Right now? We don’t have these ingredients.
Step 1: Look at
For those unfamiliar,
Now let’s apply some tools:
- Anchored VWAP (AVWAP): Tracks the average position of buyers/sellers from a specific swing (like a cost-basis anchor).
- Fixed Range Volume Profile (FRVP): Shows where most trading occurred (value area, POC, low/high volume nodes).
What
- The upper AVWAP band from the swing low (A) is at 1.12T.
- The upper AVWAP band from the swing high (B) is also at 1.12T.
- Price is retracing into the Value Area High (VAH). This lines up with:
- An ascending trendline retest and a Fib retrace (0.75–0.786 zone).
- When AVWAP bands from opposite swings collide like this, it’s a double-sided supply zone.
- Longs from the low see this area as “expensive” → they reduce risk.
- Shorts from the top defend their break-even.
- This creates a congestion zone where strong reversals often happen unless fresh spot demand breaks through.
Example: Imagine two teams pushing on opposite sides of a door at the same time. Unless one side gets backup (spot demand), the door doesn’t move — it slams shut.
Step 2: Apply This to
Now, let’s clear one thing up:
But here’s why it still matters for ETH:
- ETH often moves in strong correlation with altcoins, especially during risk-on or risk-off events.
- When TOTAL3 is at a critical resistance or AVWAP collision zone, it usually signals that risk appetite across alts is stretched.
- And since ETH trades like a “bridge asset” between BTC and alts, it tends to get caught in the same flows.
So while ETH isn’t included in
Step 3: Check USDT Dominance (USDT.D)
Yes, you can chart USDT dominance, and it’s often a leading indicator. Why?
- If USDT.D goes up → money flows into stablecoins → crypto selling pressure.
- If USDT.D goes down → money flows into crypto → bullish risk-on move.
Right now:
- USDT.D broke out of a descending trendline and is retesting the breakout region.
- It’s also printing a harmonic pattern that suggests upside continuation.
Step 4: Order Flow – who’s really buying ETH?
This is where the story gets clear:
- Aggregated Spot CVD = trending down heavily.
- Price goes up while spot CVD goes down = spot is selling into strength → no real demand.
- Futures CVD (stablecoin-margined) = trending up heavily.
- This means perps are pushing price higher with leverage.
- Futures CVD (coin-margined) = trending down.
- Another divergence → no strong confirmation from that side either.
Stablecoin OI:
- First impulse up = OI dropped → shorts closing, not buyers entering.
- Since Oct 1, OI rising → new longs piling in.
- ByBit Order Flow: heavy leveraged longs entering, but looks like absorption.
For those that don't understand it:The rally is built on FOMO leverage longs, not real buyers. That’s fragile.
Conclusion
All the ingredients are here for a mega squeeze:
- TOTAL3 at double AVWAP + VAH + Fib confluence,
- ETH backfilling inefficiencies into double AVWAP supply,
- USDT dominance signaling risk-off,
- Order flow showing no spot demand, only leveraged perp longs.
When this unwinds, it won’t just be ETH. Expect broad crypto to follow.
The trap is unfolding. Don’t get caught on the wrong side.
Nota
Check the Aggregated CVD data here: ibb.co/VW7cyVfmThe CVD spot <> CVD futures divergence is clearly visible.
Nota
Idea is still very valid and the data has not changed, only made it stronger.
Nota
Still active. Penerbitan berkaitan
Penafian
Maklumat dan penerbitan adalah tidak dimaksudkan untuk menjadi, dan tidak membentuk, nasihat untuk kewangan, pelaburan, perdagangan dan jenis-jenis lain atau cadangan yang dibekalkan atau disahkan oleh TradingView. Baca dengan lebih lanjut di Terma Penggunaan.
Penerbitan berkaitan
Penafian
Maklumat dan penerbitan adalah tidak dimaksudkan untuk menjadi, dan tidak membentuk, nasihat untuk kewangan, pelaburan, perdagangan dan jenis-jenis lain atau cadangan yang dibekalkan atau disahkan oleh TradingView. Baca dengan lebih lanjut di Terma Penggunaan.