Pattern Context
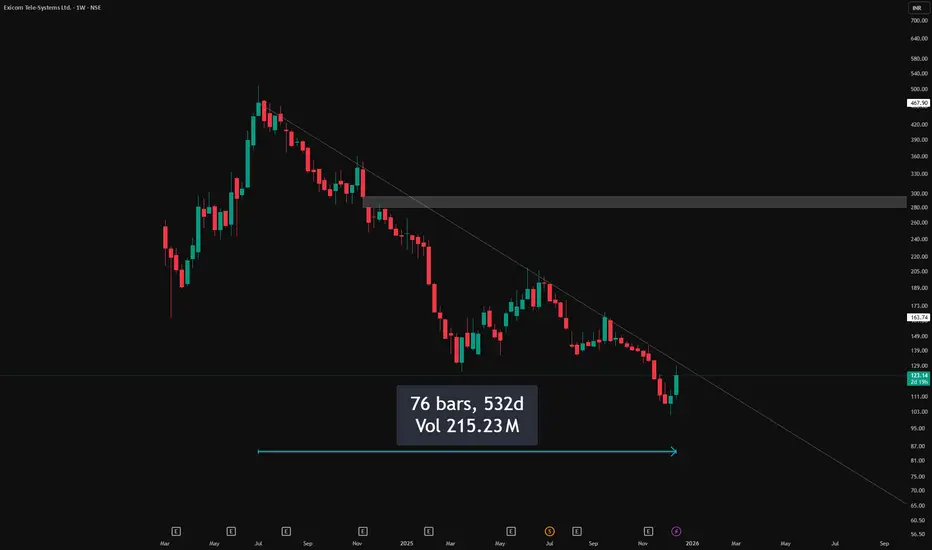
Price has been respecting a well-defined descending trendline on the weekly timeframe, with each rally stalling below the previous swing high and reinforcing the broader lower‑high, lower‑low sequence.
Candlestick Behavior
Showing how supply continues to respond at the same diagonal zone. This reaction visually confirms how aggressively the market has been defending the pattern’s upper boundary without implying what comes next, keeping the focus strictly on how price has behaved historically around this line.
Observational Takeaway
This chart serves as a clear example of how a simple, clean trendline can organize price behavior over multiple months and frame where participation repeatedly shifts. The emphasis here is on observing how consistently the structure has been respected and how each touch has shaped the ongoing sequence, allowing traders to study price interaction with a dominant trend rather than anticipate future outcomes.
Disclaimer
This post is for educational and informational purposes only and is not investment advice, stock tips, or a recommendation to buy or sell any security. Readers should do their own research, consider their personal risk tolerance, and consult a registered financial professional if needed before making any trading or investment decisions.
🎯 Master My Self-Made Trading Strategy
📈 Telegram (Learn Today): t.me/hashtaghammer
✅ WhatsApp (Learn Today): wa.me/919455664601
📈 Telegram (Learn Today): t.me/hashtaghammer
✅ WhatsApp (Learn Today): wa.me/919455664601
Penerbitan berkaitan
Penafian
Maklumat dan penerbitan adalah tidak bertujuan, dan tidak membentuk, nasihat atau cadangan kewangan, pelaburan, dagangan atau jenis lain yang diberikan atau disahkan oleh TradingView. Baca lebih dalam Terma Penggunaan.