Price Action & Commentary
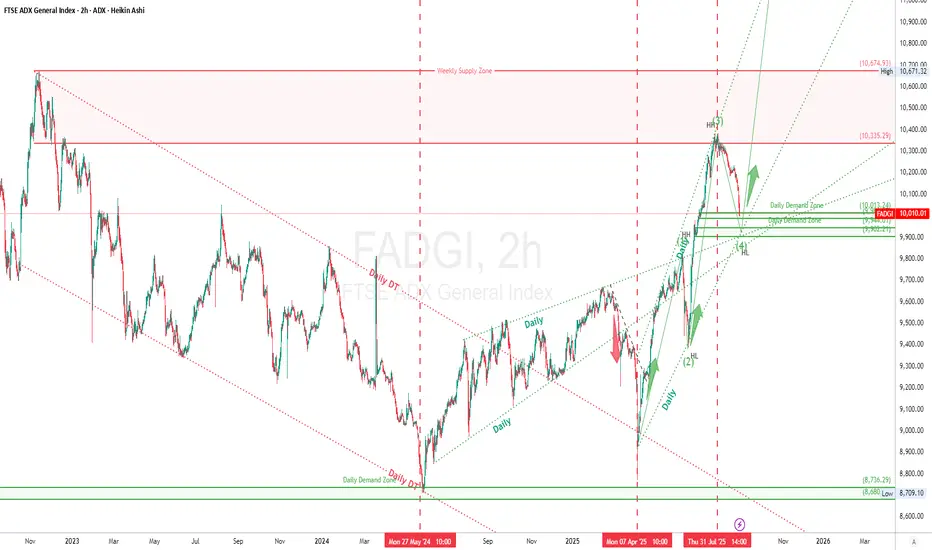
The ADX General index (FTSE ADX ) completed a massive bullish leg from April 2025, breaking out of a multi-year descending channel and shifting into a bullish structure with higher highs and higher lows (HH/HL).
After printing a potential Wave 3 top at ~10,376, price sharply reversed with a clear correction pattern, likely completing Elliott Wave 4 correction.
Price has now entered into a key Daily Demand Zone (~9,96 - 10.013), if the zone holds and impulsive wave 5 should follows.
Another deeper RBR demand zone can be spotted (9,902-9,944) which might act as a reversal zone if the upper zone didn't hold.
Elliott Waves
Wave (1): Initial impulse post descending breakout.
Wave (2): Pullback/retest of broken structure.
Wave (3): Strong rally into new highs (ending near 10,380).
Wave (4): Ongoing correction, likely near completion within the current Daily Demand Zone or the deeper one.
Wave (5): Expected next — if the zone holds and impulse follows, targeting new highs above 10,380 (July 31st high) or 10,700 (Nov 2022 high), or even 11,145 (Max extension of wave 5).
Supply & Demand Zones
🔴 Weekly Supply Zone: 10,335 – 10,674 (Strong selling origin)
🟢 Daily Demand Zone (current focus): 9,922 – 9,985 (price reacting here)
🟢 Deep Demand Zone (historical): 8,709 – 8,736 (last-resort support)
RSI Divergence
RSI is extremely oversold with a Bullish RSI divergence developing on lower timeframes.
⚠️ Disclaimer
This is not financial advice. All trading involves risk. Perform your own analysis or consult a financial advisor before making decisions.
🏷️ Tags
#FADGI #ADX #SwingTrade #SupplyDemand #ElliottWave #HeikinAshi #RSI #RiskManagement #TradingView#DubaiTradersHub
By Dubai Traders Hub
Follow us on X , YouTube, and Join our Telegram Channel
Follow us on X , YouTube, and Join our Telegram Channel
Penafian
Maklumat dan penerbitan adalah tidak dimaksudkan untuk menjadi, dan tidak membentuk, nasihat untuk kewangan, pelaburan, perdagangan dan jenis-jenis lain atau cadangan yang dibekalkan atau disahkan oleh TradingView. Baca dengan lebih lanjut di Terma Penggunaan.