Singkat
Swing PUTS - see 30m, daily, weekly charts
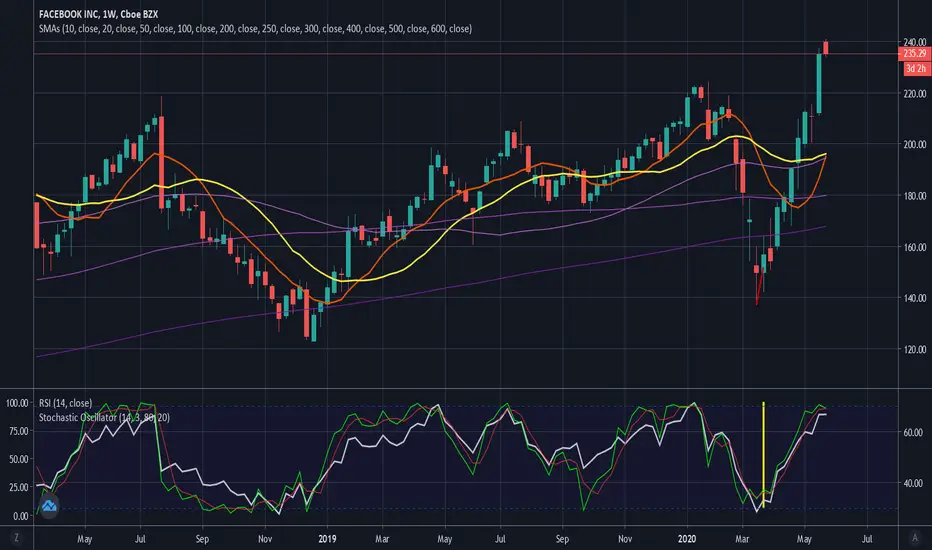
The weekly chart gives you the reason for puts. On 30min chart the stochastic is below RSI. Here are confirmations:
* 30min RSI below 50
* daily stochastic moving below RSI
* bearish candle patterns
Set targets and take profits along the way.
I used 5 and 30 min charts to buy weekly 235 puts at $2.80 and I sold most of them for $3.50. Swing puts will allow you to capture overnight selling, while buying and theta will "hurt" your position less. You can also watch this chart over the next two weeks to predict and learn. There will be multiple trading opportunites on 5-30 min timeframes.
Penafian
Maklumat dan penerbitan adalah tidak dimaksudkan untuk menjadi, dan tidak membentuk, nasihat untuk kewangan, pelaburan, perdagangan dan jenis-jenis lain atau cadangan yang dibekalkan atau disahkan oleh TradingView. Baca dengan lebih lanjut di Terma Penggunaan.
Penafian
Maklumat dan penerbitan adalah tidak dimaksudkan untuk menjadi, dan tidak membentuk, nasihat untuk kewangan, pelaburan, perdagangan dan jenis-jenis lain atau cadangan yang dibekalkan atau disahkan oleh TradingView. Baca dengan lebih lanjut di Terma Penggunaan.