Combining H1 and 5-Minute Charts for Tomorrow’s Trading Plan
Based on the technical analysis of both the H1 and 5-minute charts, the following conclusions and trading strategies can be drawn:
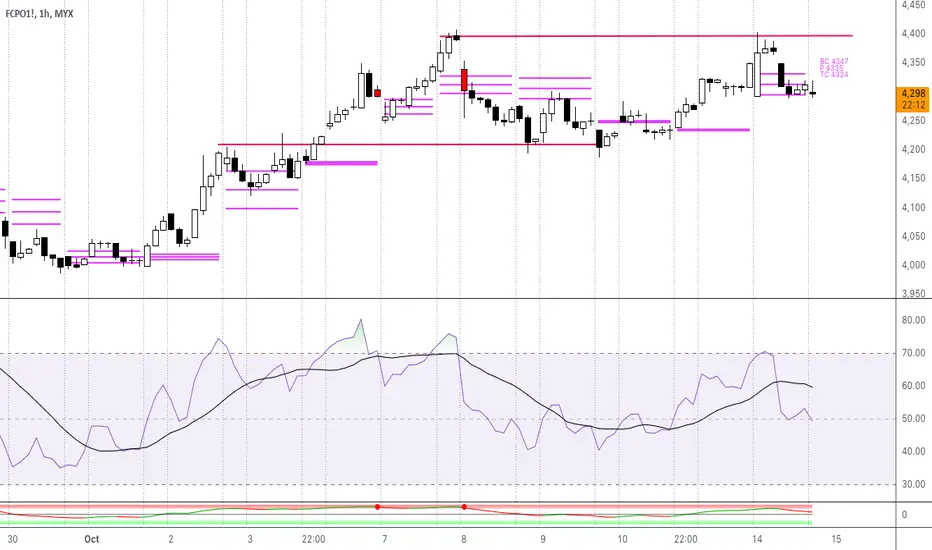
Watch for a Breakout Above 4,400 (H1):
A confirmed breakout above the 4,400 resistance level on the H1 chart could provide an opportunity for long positions, targeting 4,450 and possibly higher. The key is to wait for a strong bullish confirmation with accompanying volume.
4,240 Support Holds the Key (H1):
Should the price fail to hold 4,240 on the H1 chart, a significant downside move could occur. Look for short opportunities with potential targets around 4,200 and possibly 4,160.
Intraday Focus on 4,320 - 4,300 Zone (5-Minute Chart):
On the 5-minute chart, the market is showing signs of exhaustion. If the 4,300 support holds in early trading tomorrow, a quick bounce toward 4,320 is likely. However, if 4,300 is broken, look for a potential move lower.
RSI and Momentum Indicators:
Keep an eye on the RSI for any signs of divergence or overbought/oversold conditions, as these could provide early warning signs for reversals.
Based on the technical analysis of both the H1 and 5-minute charts, the following conclusions and trading strategies can be drawn:
Watch for a Breakout Above 4,400 (H1):
A confirmed breakout above the 4,400 resistance level on the H1 chart could provide an opportunity for long positions, targeting 4,450 and possibly higher. The key is to wait for a strong bullish confirmation with accompanying volume.
4,240 Support Holds the Key (H1):
Should the price fail to hold 4,240 on the H1 chart, a significant downside move could occur. Look for short opportunities with potential targets around 4,200 and possibly 4,160.
Intraday Focus on 4,320 - 4,300 Zone (5-Minute Chart):
On the 5-minute chart, the market is showing signs of exhaustion. If the 4,300 support holds in early trading tomorrow, a quick bounce toward 4,320 is likely. However, if 4,300 is broken, look for a potential move lower.
RSI and Momentum Indicators:
Keep an eye on the RSI for any signs of divergence or overbought/oversold conditions, as these could provide early warning signs for reversals.
Nota
See full analysis from masterfcpotrading.com/daily-analysis/14-october-2024/Penafian
Maklumat dan penerbitan adalah tidak dimaksudkan untuk menjadi, dan tidak membentuk, nasihat untuk kewangan, pelaburan, perdagangan dan jenis-jenis lain atau cadangan yang dibekalkan atau disahkan oleh TradingView. Baca dengan lebih lanjut di Terma Penggunaan.
Penafian
Maklumat dan penerbitan adalah tidak dimaksudkan untuk menjadi, dan tidak membentuk, nasihat untuk kewangan, pelaburan, perdagangan dan jenis-jenis lain atau cadangan yang dibekalkan atau disahkan oleh TradingView. Baca dengan lebih lanjut di Terma Penggunaan.