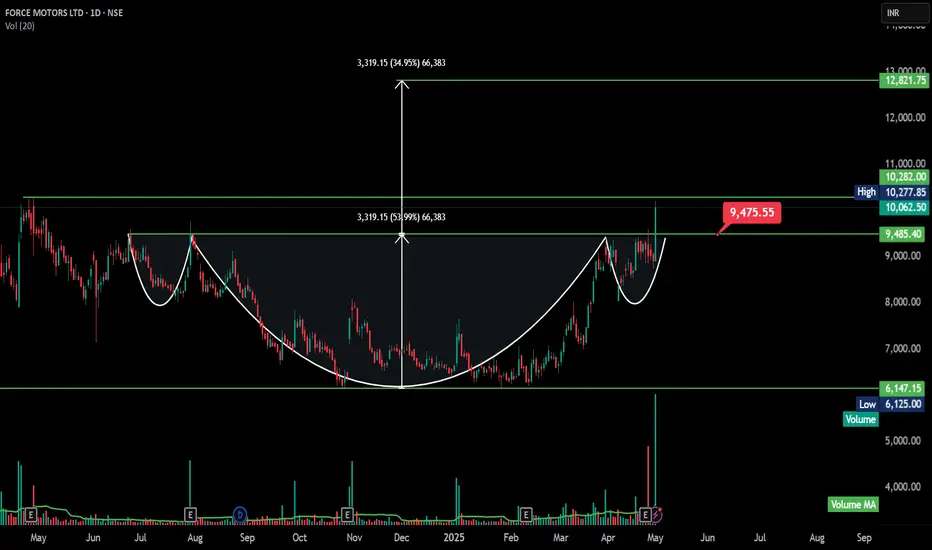
The chart technical analysis of Force Motors Ltd (NSE)**, showing a **cup and handle breakout pattern**—a bullish continuation formation. Here's a breakdown of the key insights:
---
# Pattern: Inverted Head and Shoulders (Bullish Reversal)
Left Shoulder: Formed around July–August 2023.
Head: Formed in December 2023, with a deeper low.
Right Shoulder: Formed in April 2025, with a higher low.
Neckline: Drawn across the resistance zone around ₹9,475.55 — now broken.
💥 Breakout Confirmation
Price has broken above the neckline at ₹9,475.55, closing at ₹10,062.50 with a strong 12.88% gain and high volume, confirming the bullish breakout.
📊 Measured Move Target
Height (Head to Neckline) ≈ ₹3,319.15
Breakout Target = ₹9,475.55 + ₹3,319.15 = ₹12,821.75
→ This matches the projection shown on the chart (~35% upside from breakout)
🔍 Volume Analysis
Breakout is accompanied by a large volume spike (~810K vs avg), which is critical for validating an inverted head & shoulders breakout.
📏 Key Technical Levels
Breakout Point / Neckline: ₹9,475.55 (Now Support)
Resistance: ₹10,277.85 (intraday high on breakout day)
Target: ₹12,821.75
Stop-loss: Below ₹9,475 (e.g., ₹9,200–9,300 zone), depending on risk tolerance
🧭 Strategic Takeaway
This breakout from an inverted H&S pattern suggests a bullish trend reversal after a prolonged downtrend, and the volume confirmation adds strength to the setup.
Penafian
Maklumat dan penerbitan adalah tidak bertujuan, dan tidak membentuk, nasihat atau cadangan kewangan, pelaburan, dagangan atau jenis lain yang diberikan atau disahkan oleh TradingView. Baca lebih dalam Terma Penggunaan.
Penafian
Maklumat dan penerbitan adalah tidak bertujuan, dan tidak membentuk, nasihat atau cadangan kewangan, pelaburan, dagangan atau jenis lain yang diberikan atau disahkan oleh TradingView. Baca lebih dalam Terma Penggunaan.